Your home or office network might be slow, not because of ISP issues, but because someone else has Netflix on.
It is estimated that the average bandwidth usage for YouTube is 0.73 GB/hr, while Netflix in HD is around 2.8 GB/hr.
If you are surprised by how high your bandwidth billing is or by how slow your connection is at times, you can use flow technology.
This technology helps you see what is causing the lag so that you can pinpoint the issue and correct it.
In other words, Flow technology, such as sFlow helps you see what is going on in your network, from the data link to the applications layer.
Analyzing flows can give you answers into who is using the bandwidth, the users that are consuming the most, the applications, etc.
What is sFlow?
sFlow, stands for “sampled-Flow ” and is a standard-based protocol for exporting information from packets traveling through a network. It selects individual packets and sends sampled traffic frames to an sFlow collector.
sFlow was created by INMON Corporation and the protocol has evolved into an industry standard for more than 60 network vendors, such as Alcatel, Dell, and D-Link.
sFlow was designed to be extremely extensible and flexible and is the only flow technology that samples traffic, in contrast to the popular NetFlow technology that mirrors and exports traffic.
The protocol is used as a simple network monitoring tool.
Not only is sFlow a great way to troubleshoot bandwidth utilization issues and find applications that are driving network traffic, but it can also help you get insights into historical trends and traffic patterns.
You can learn how application traffic changes through time, so you can efficiently allocate your bandwidth.
Knowing about traffic changes and unusual patterns can also help you discover vulnerabilities in security.
Why is it used instead of Netflow for Flow Collection?
If you have been working with Cisco equipment and analyzing flows, you might be familiar with Netflow.
Netflow is a popular protocol developed by Cisco and is used for collecting traffic flow information and analyzing it.
As mentioned before, NetFlow exports traffic. It aggregates the IP flows and sends the totals.
On the other hand, sFlow is a general-purpose traffic monitoring protocol.
It can provide constant monitoring statistics on any protocol, from L2, L3, L4, and L7, etc.
Having these level of high-grade statistics is perfect for troubleshooting the network, monitoring bandwidth, planning for capacity, and enforcing security.
Aside from having more diverse monitoring capabilities than NetFlow, sFlow is a lighter solution.
Network admins prefer sFlow when collecting flow information because it places a lighter load on the CPU and memory.
sFlow is a sampling technology— so it only captures packets in a random pattern, for example, every 200th packet.
NetFlow, on the other hand, exports all flow records and puts a bigger load on the network device’s CPU and memory.
The below chart shows the most common advantages of sFlow vs. NetFlow.
| Supported protocols | CPU and Memory Load | Supported Vendors | |
| NetFlow | Layer 2, 3, 4. | High | Supported by over eight vendors. |
| sFlow | Layer 2, 3, 4, 7. | Minimal | Supported by over sixty vendors. |
Here’s the Best Sflow Collectors & Analzyers of 2026:
Below is a list of the top 5 software tools that are capable of collecting and analyzing sFlow data. From free and open-source tools to the most comprehensive tools for large networks.
1. SolarWinds sFlow Collector and Analyzer Tool
Solarwinds sFlow Collector Tool comes as additional functionality of the NetFlow Traffic Analyzer (NTA).
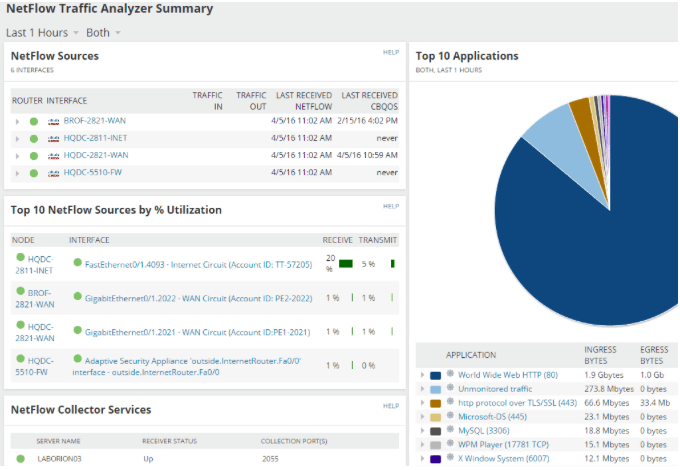
The NTA is a flow collector and analyzer tool and is capable of automatically collecting sFlow traffic information from sFlow-enabled network devices, and providing a complete analysis of the flows.
With this software, you can identify which users, applications, and protocols are using the most bandwidth.
The NTA dashboards show the top-ten used applications, with name, protocol, and bytes used.
The dashboard can help you determine the apps that are consuming the most resources.
You can also monitor the traffic flows coming from specific interfaces, ports, IPs, and even protocols.
This can help you sort out the top talkers— the users that are consuming the most data and bandwidth.
Features:
- Monitor bandwidth.
- Send alerts based on application traffic.
- Network traffic analysis
- Identify malicious traffic.
Price:
30 Day Free Trial!
Download:
Fully functional free trial of NetFlow Traffic Analyzer for 30 days, and start collecting and analyzing sFlow.
2. ManageEngine NetFlow Analyzer
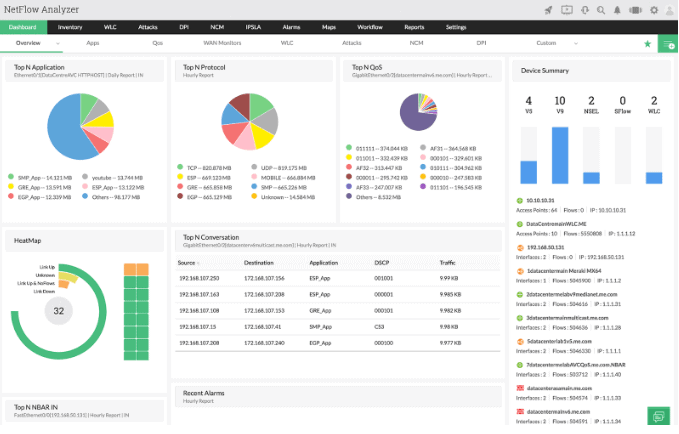
NetFlow Analyzer from ManageEngine is a comprehensive traffic analysis tool that provides insights in real-time into the network bandwidth and traffic patterns.
It supports different flow technologies such as NetFlow, sFlow, Netstream, IPFIX, j-Flow, and AppFlow.
NetFlow Analyzer can collect, analyze, and report flow information from your network bandwidth.
With sFlow, you can use the analyzer to show you who is using most of the bandwidth, at what time, how much, and with what application.
Features:
- It can monitor bandwidth and traffic trends.
- Monitor abnormal network traffic and run a forensic analysis.
- Keep track of specific application traffic and shape it.
- Plan for capacity and billing.
Price:
The Netflow Analyzer comes in two different editions, the Essential ($595 for up to 50k flows) and Enterprise ($1295 for 80k flows per collector).
Download:
30-day free trial of Essential or Enterprise editions.
3. Wireshark
Wireshark is probably found on every toolbox of the best network engineers and IT managers.
If you don’t know it yet, Wireshark is a free and 100% open-source network packet analyzer.
It is commonly used for network troubleshooting, analyzing security issues, verifying network applications, and even for debugging new protocol implementations.
With Wireshark, you can capture all kinds of flow data, from wired, wireless, to virtual interfaces.
It supports the most popular flow standards, like Netflow, j-Flow, sFlow, and more.
Wireshark works based on traces. To start a trace, you can select a destination, a protocol, port, etc.
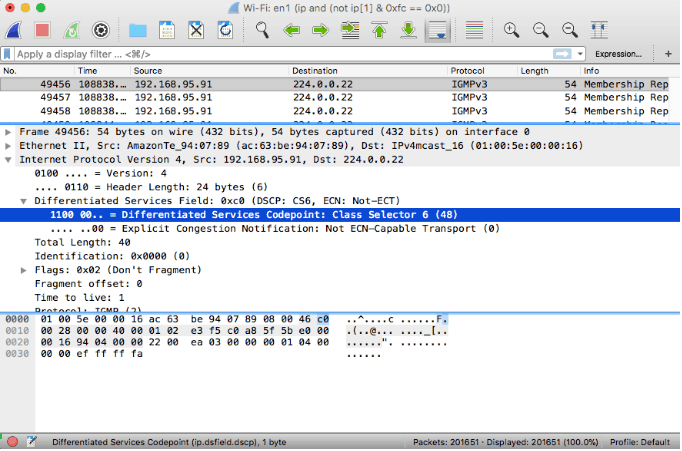
Wireshark will capture traffic with sFlow, but you’ll need to ensure that the switches (sFlow agents) are sending and receiving sFlow packets. Then make sure that the switches forward all sFlow feeds to Wireshark.
Features:
- Wireshark will collect all sFlow feeds from switches or individual network devices.
- It allows you to go into the sFlow packet header and see its contents.
- With Wireshark you can keep track of sFlow counter samples, such as interfaces status, speed, errors, etc.
- Dig deep into the Layer 7 applications. Wireshark can show you the applications being used in a specific flow.
- Wireshark comes with a graphical UI
- Supported by Windows, macOS, Linux, and UNIX-based OSs.
Price:
Free and open-source
Download:
Wireshark for free here.
4. ntopng with nProbe
ntopng stands for “ntop next-generation” and is a free and open-source traffic monitoring software.
It was initially designed to be a low-resource and higher-performance substitute for ntop. With the help of nProbe, which is a flow probe and collector, you can visualize all traffic data from ntopng.
nProbe can collect flow information using common protocols such as NetFlow, j-Flow, and sFlow from network devices.
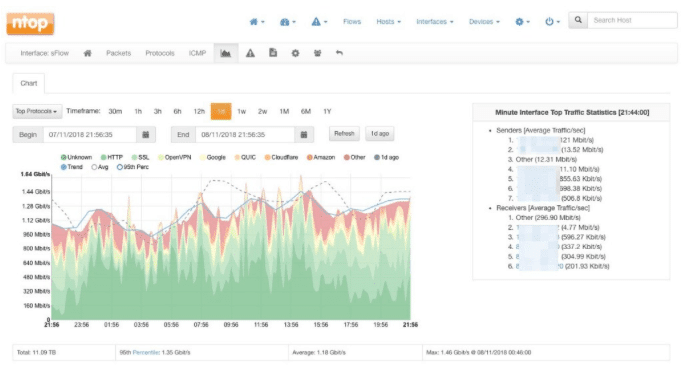
nProbe works together with ntopng. Once nProbe collects all traffic data, it sends it back to ntopng for visualization and analysis.
You need two ntop tools to be able to collect sFlow data and analyze it:
- nProbe: Collects sFlow data from hundreds of network devices at the same time and exports it to ntopng. It is light, fast, and can analyze large networks with zero packet loss. It can send monitoring flows to ntopng or any other commercial sFlow analyzers.
-
ntopng: ntopng provides the intuitive web user interface where you can explore all traffic in real-time and historical views. It receives the data from nProbe and provides insights through visualizations. ntopng is light and portable. It can run on every Unix platform, macOS, and Windows operating systems.
Price:
Free and open-source.
Download:
nProbe and ntopng from ntop official website.
5. Plixer Scrutinizer
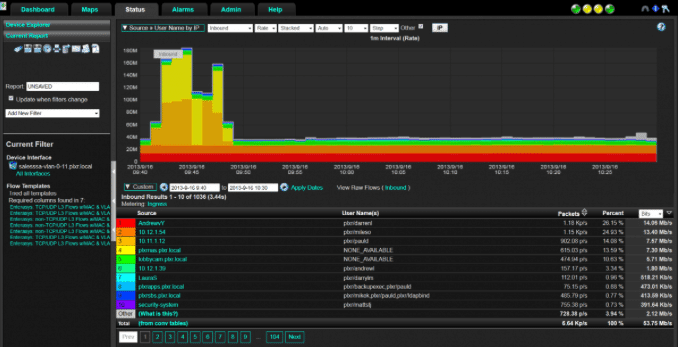
Scrutinizer from Plixer is a network traffic collector and analysis software.
It can gather flows from any network connection and provide analysis and visualizations of the traffic.
It also provides you with real-time insights and historical data. Scrutinizer supports all versions of NetFlow, IPFIX, and sFlow data.
Scrutinizer helps you troubleshoot network traffic issues, by correlating flows and metadata collected from the network.
It can filter all collected data and create insightful reports that can help you determine who is using what, when it is being used, how much is being used, etc.
Features:
- 10,000 to millions of flows collected per second.
- It keeps unlimited historical flow rollups.
- It comes with advanced reporting functionality.
- Full stitching and deduplication
- Create filters to search through traffic flows.
Price:
Scrutinizer comes in four different editions, Free, MDX, SSRV, and SCR. For more information on pricing, get a quote.
Download:
Scrutinizer’s free edition or try an evaluation for MDX, SSRV, and SCR for a limited time.
Final Words
When collecting and analyzing flow traffic, Cisco equipment uses NetFlow, Juniper uses j-Flow, and Huawei uses NetStream.
But all other vendors (+60) including the ones already mentioned, use the open-source technology, sFlow.
sFlow is a sampling protocol that exports interfaces and traffic packets information from network devices.
The sFlow agents run on switches, routers, firewalls, or any other sFlow-enabled equipment and continuously exports information via UDP or through sFlow collectors. Since sFlow only samples packet, it is ultra-light on the CPU and memory resources as compared to NetFlow, which mirrors the entire traffic.
All the flow collector and analyzer tools shown here support sFlow.
They can provide the necessary information you need to discover big talkers on the network, top consuming applications, and all the insights into the who, when, what, how, and why.
