Whether you’re a small business owner or manage a global enterprise, proper monitoring is an essential component of IT infrastructure. Maintaining complete visibility of your network uptime and performance makes it possible to recognize problems before they even occur.
You might expect to find a hefty price tag attached to such software, and many professional solutions do incur licensing fees, but some of the best tools are actually open source and free to use. While the price (or lack thereof) is one obvious advantage, the real perks of open source include rapid development, decentralized management and community based support.
Over the course of this article, we will look at 5 of the best open source network monitoring tools on the market. These are just as capable, sometimes even more so than the paid products, and you don’t have to spend a dime.
Best Open Source Network Monitoring Software of 2026:
- Nagios Core
- Zabbix
- Prometheus
- Icinga 2
- Cacti
1. Nagios Core
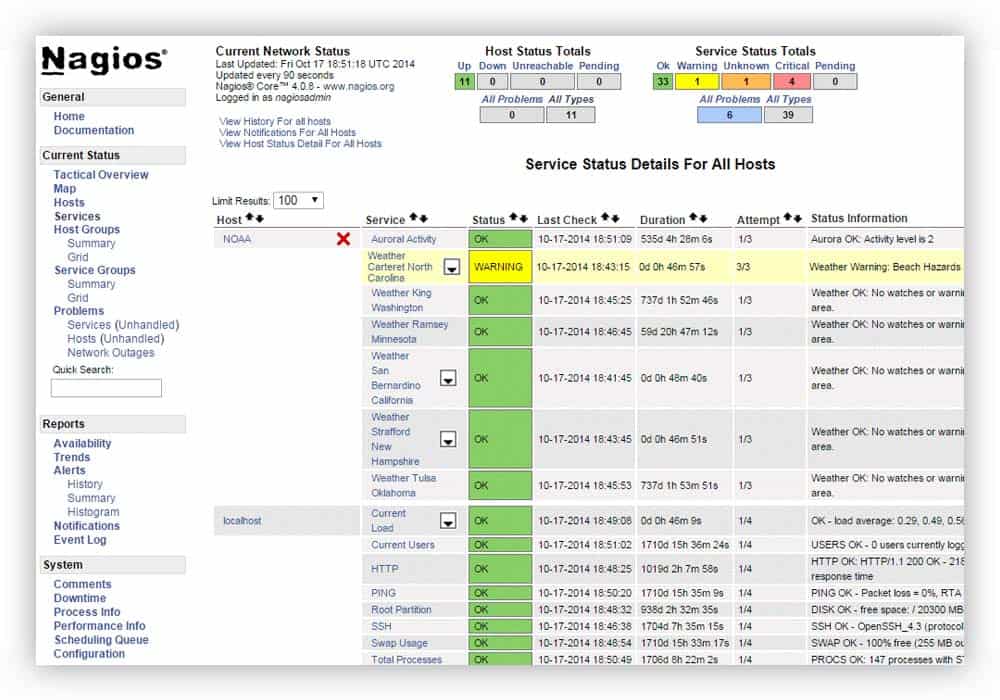
As the self proclaimed industry standard, Nagios Core is a basic monitoring and alerting engine, which also happens to be the foundation for hundreds of other projects.
It’s one of the oldest solutions on the market, but it’s well documented, widely supported and extremely stable. On the flip side, the learning curve is quite steep and may overwhelm the faint of heart.
Nonetheless, the extensive support for customization is ultimately what sets it apart, making it one of the most versatile options on our list.
The official Nagios Exchange is a central database of more than 4,000 plugins, addons and extensions. These range from cosmetic UI enhancements to complete integrations with external services.
When directly compared to the feature set of Nagios XI, the paid enterprise version, Nagios Core is rather limited outside of its fundamental tools.
For those that need more than just monitoring and alerting, almost everything else can substituted using 3rd party software from the Exchange.
2. Zabbix
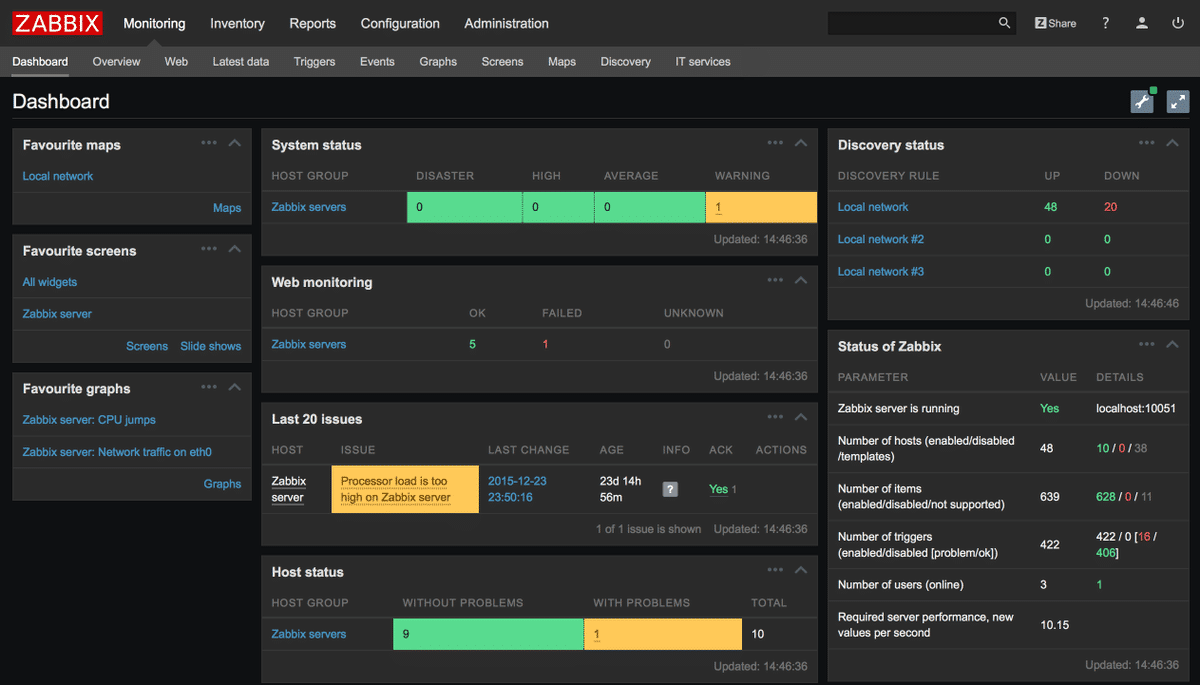
Zabbix is among the most popular open source, enterprise grade monitoring solutions on the market. In contrast to the Nagios distribution model, there is no paid edition being dangled over your head to entice an upgrade. There is just one version of Zabbix and it’s completely free, packed with verbose monitoring tools for networks, servers, cloud, application and services.
As a relative newcomer to the scene, it feels quite a bit more intuitive than many alternatives. Out of the box, the setup is simple and can be completed in 30 minutes, no prior experience required.
The web interface is sleek and easy to navigate, with a modern front-end that was recently redesigned. Best of all, performance data is collected from user agents with SNMP, providing a comprehensive look at every corner of your network in real-time.
Intended primarily for large scale infrastructure, it’s ideal for organizations that need to scale on demand. It’s used across dozens of industries, from medical to finance, and trusted by many global brands such as Dell, SalesForce and Cisco. It can absolutely work for more modest needs, but sysadmins would likely find a different solution to be a better fit.
Download
3. Prometheus
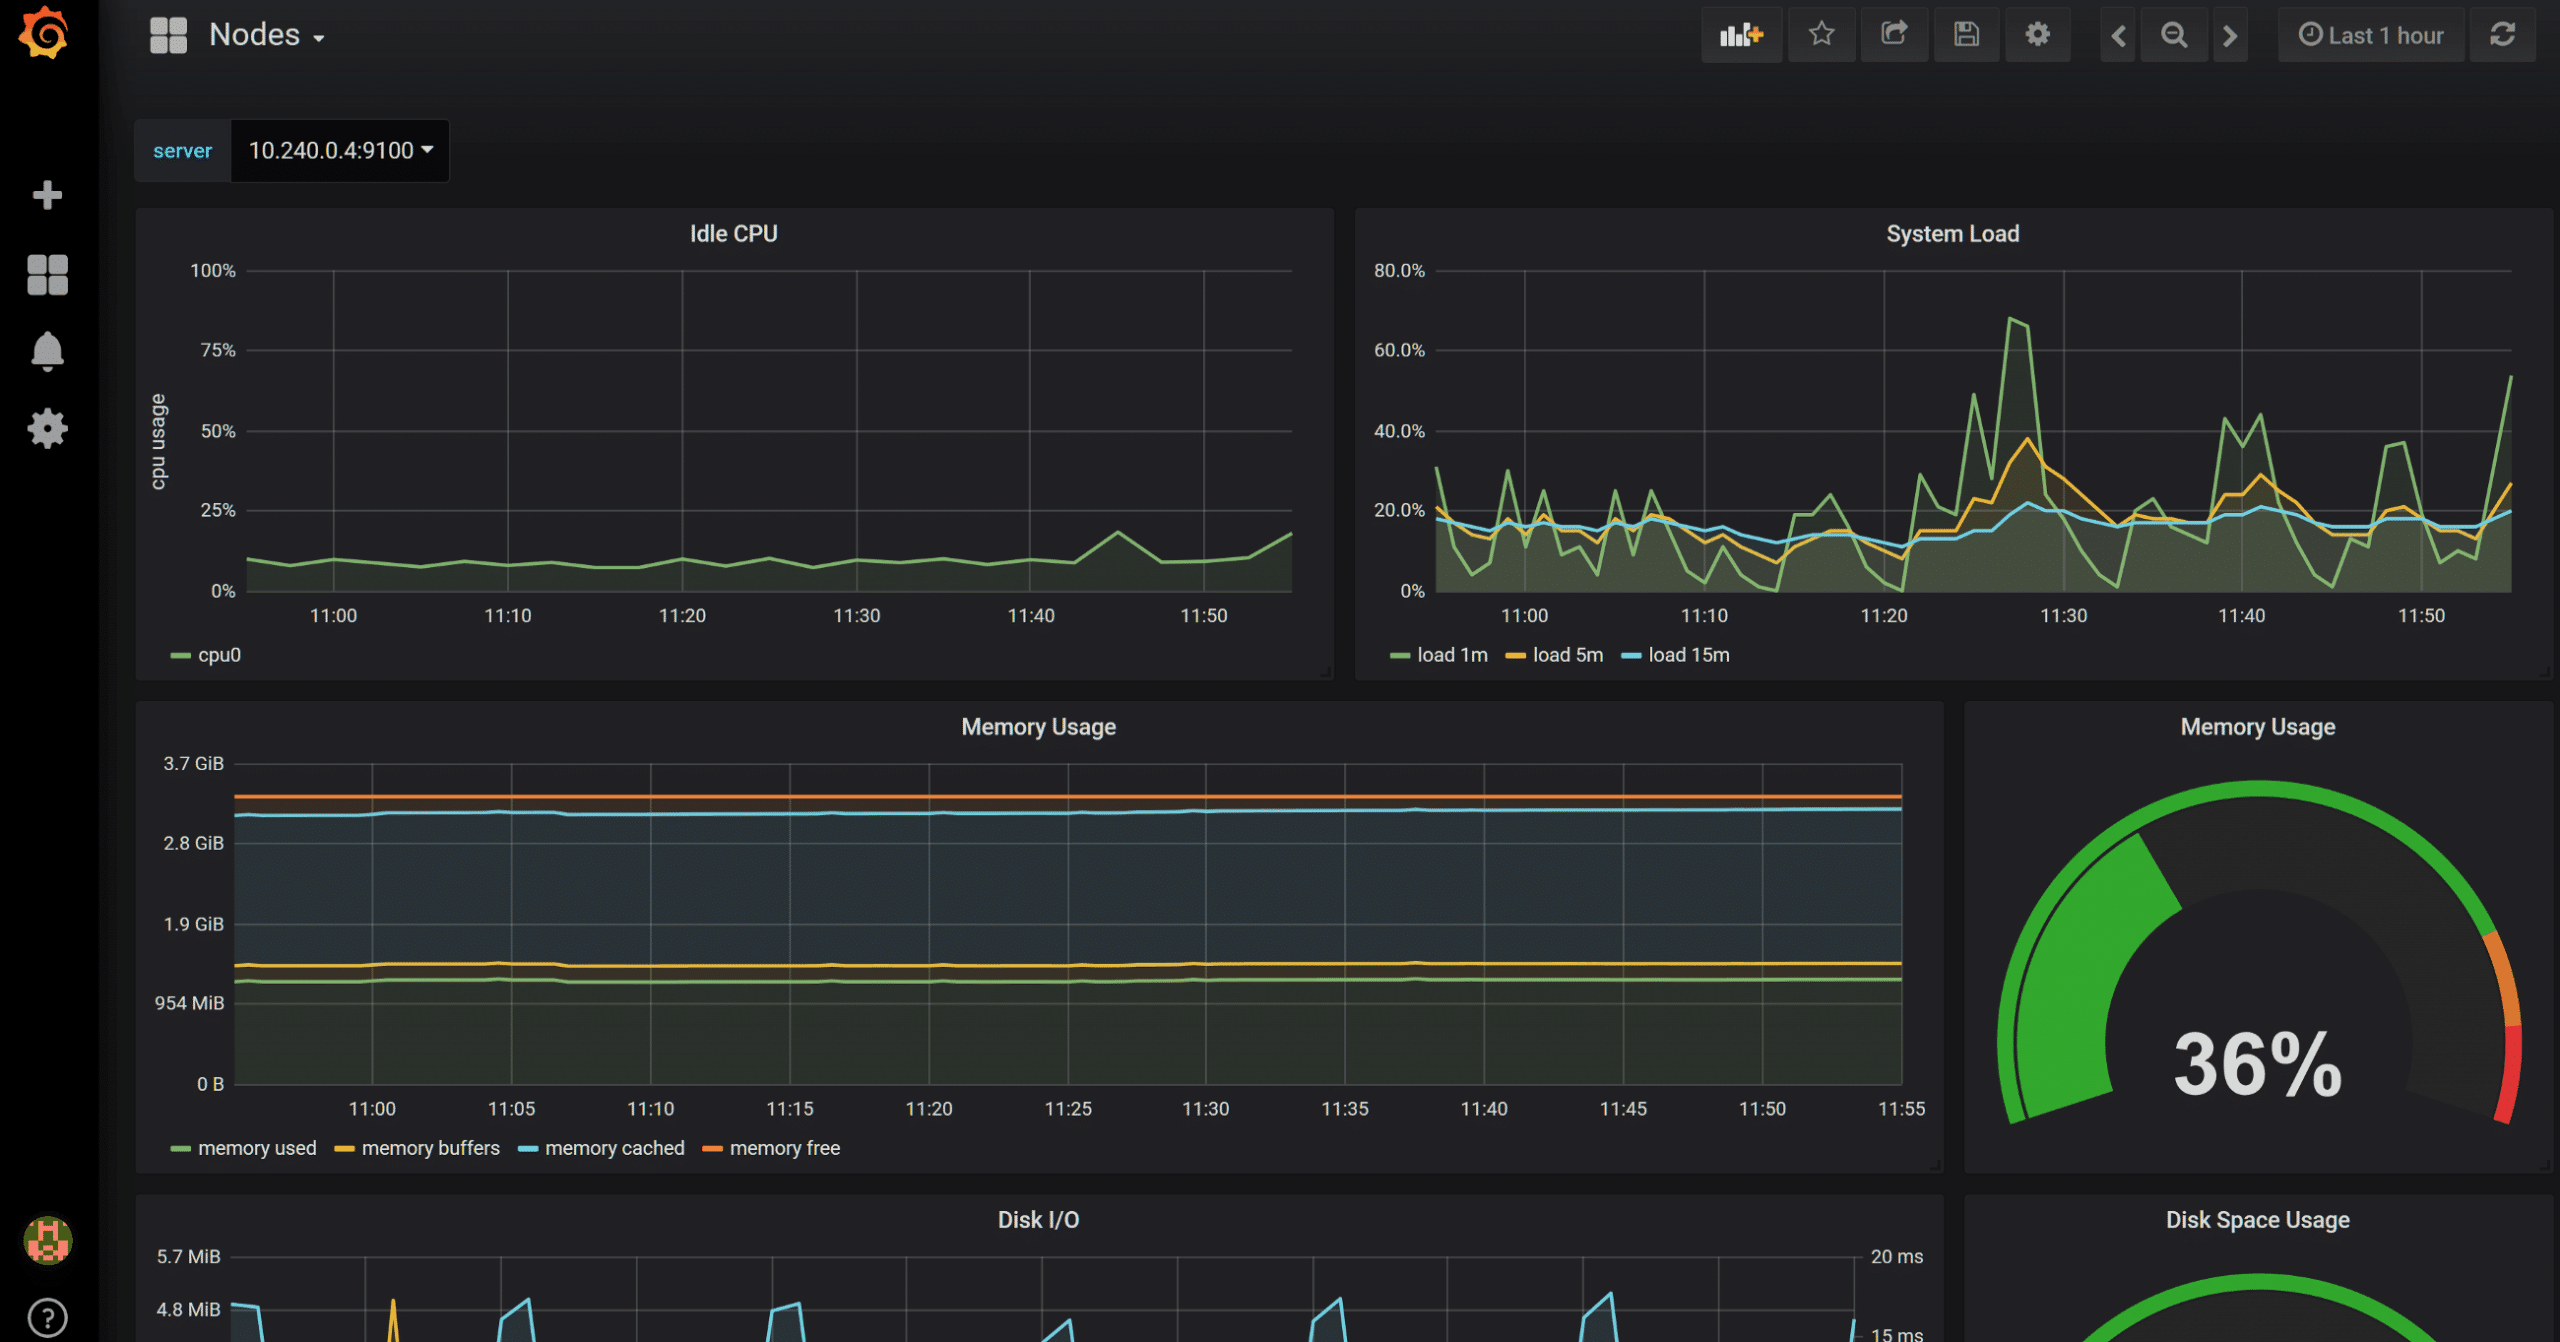
Prometheus is an open-source, community driven monitoring and alerting toolkit. Built by the Soundcloud team in 2012, It’s designed to collect time series data in a dynamic container environment, providing rich metrics and extensive customization without impact on system performance.
Taking inspiration from Borgmon, Google’s in-house monitoring solution, it brings an innovative approach to infrastructure management.
In addition to the Prometheus server architecture, which is responsible for scraping/storing time series data, there are many optional components available as well. The Alertmanager can dispatch notifications every time an event is raised, sent via e-mail, PagerDuty or OpsGenie.
Client libraries support more than 17 languages for custom application instrumentation to expose valuable metrics. There are also Push Gateways for short lived jobs, a basic web UI built on Grafana and hundreds of special purpose exporters that integrate with 3rd party services.
While suitable for networks of any size, Promethus is not an all-in-one package. For large scale deployments, it may lack in certain areas of importance such as logging features, durable storage and user management.
For these services, the developers recommend using Prometheus in combination with existing third party tools to create a more comprehensive solution.
Download
4. Icinga 2
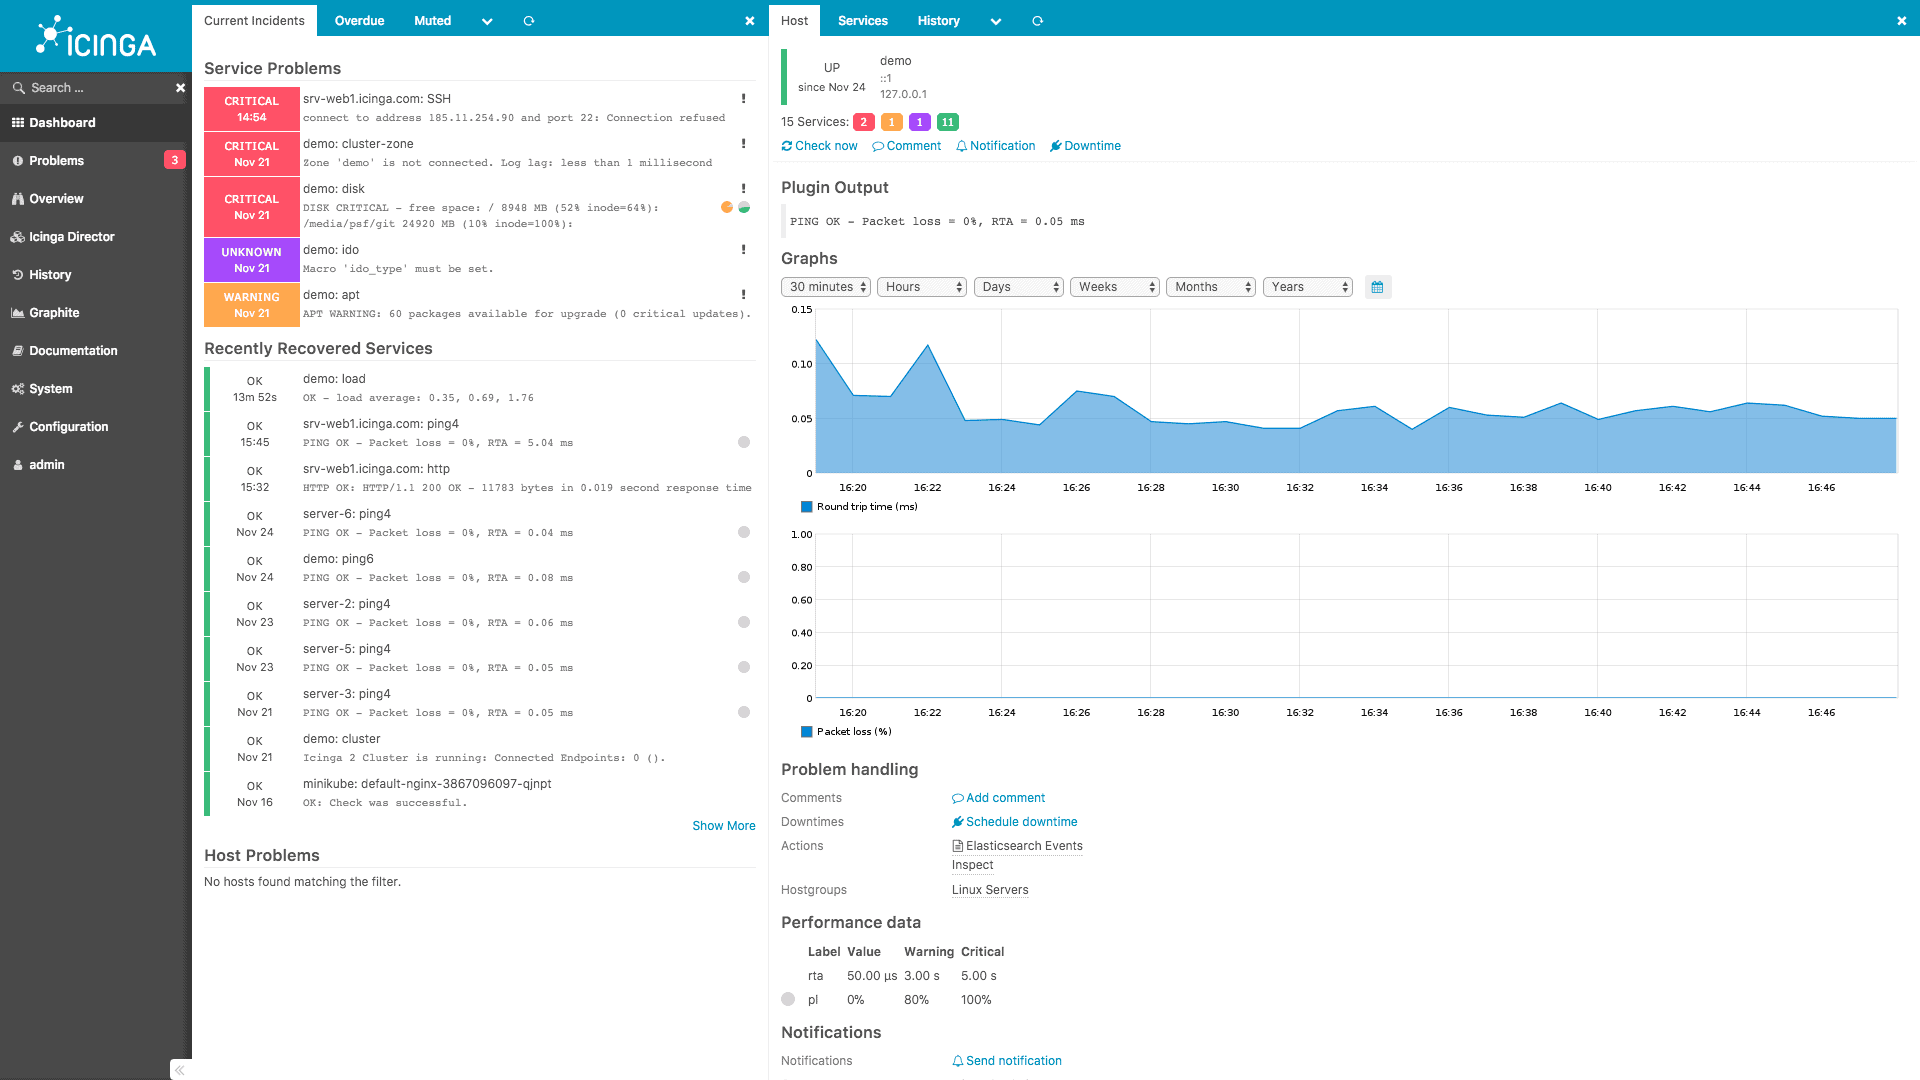
First launched in 2009, Icinga was developed as a fork of Nagios, created by a group of users who were frustrated by the severe lack of updates.
After several years, the core framework received a complete rewrite, further distancing itself from the original source code.
Despite the vast overhaul and significant changes, Icinga 2 still remains backwards compatible with the complete Nagios plugin database and many of the add-ons.
It also keeps the modular architecture in place, separating out core components such as the User Interface, Data Out Database (IDODB), Reporting and Mobile. These design choices ensure that customization is simple for the end user, and it’s a breeze to integrate new 3rd party solutions.
On the front-end, Icinga 2 offers a modernized web 2.0 interface, using widgets to provide drag-n-drop customizable dashboards. It operates as standalone software, communicating with the back-end via abstract component layers and the REST API.
For those that prefer the Classic Web UI from Nagios, it is still available and developed in parallel, giving users the choice between the two.
Download
5. Cacti
Cacti is one of the oldest, most recognizable monitoring tools in existence. For anyone that has worked on the networking side of IT in the past 20 years, it’s almost inevitable that you’ve come in to contact with it at some point in time.
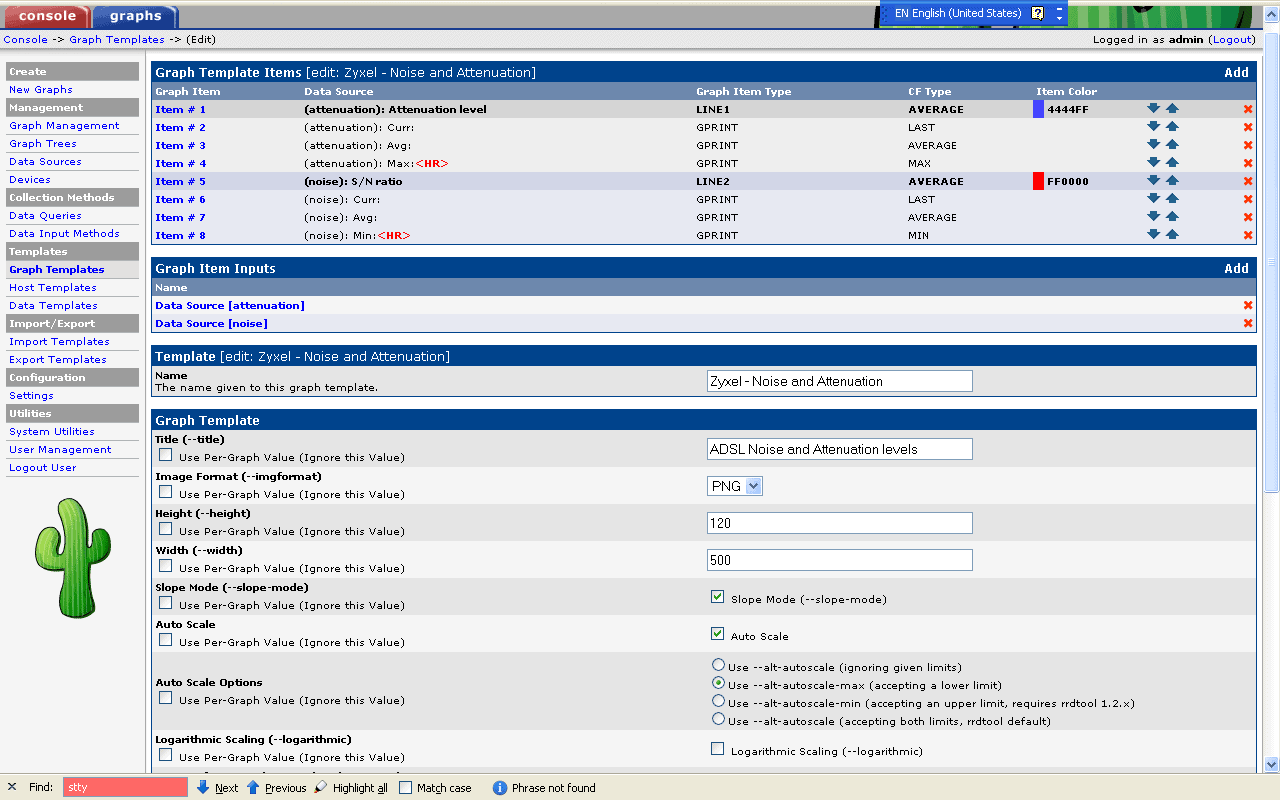
Built as an extension of the industry standard RRDTool, Cacti is a complete network graphing solution that utilizes functionality from the back-end software. It provides a fast poller, advanced templating, multiple data sources and more.
The web based front-end also supports user management, where each client can access their own unique set of graphs. This is frequently implemented by hosting providers as a customer facing service, providing statistical data within their respective control panels.
Albeit limited, Cacti does feature an extensible plugin architecture. A small library of official and user submitted addons are available via the documentation page, plus media that covers installation, development and guidelines.
Optionally, the core software can also be extended to monitor any type of data source using shell scripts or executables.
The Cacti project is actively maintained and supported by the community. Updates are released on a regular basis as part of a collaborative effort. For more information, you can visit the official repository hosted at GitHub.
Download
Final Thoughts
When it comes to network monitoring software, there are plenty of reasons to choose open source. There is no denying the fact that free is a big factor in the decision, but there are numerous incentives that are unrelated to cost.
In this case however, since money really is no object, we can exclusively compare features, functionality and other points of interest before committing to a particular solution. The right choice will depend largely on the needs of your particular organization, whatever those may be.
For large scale deployments or those with scaling requirements, Zabbix is an industry leader with enterprise grade features and the accolades to prove it’s up to the task. If your operating a homegrown network and just need the basics, Icinga 2 is worth checking out.
It has very intuitive on boarding, coupled with powerful tools to accomplish almost any goals.
If there is one we missed and you think should be included, leave us a comment and we’ll check it out!