Server Monitoring is a very important aspect of network management for several reasons.
For example, a network administrator can troubleshoot and resolve issues on a network by going through and analyzing event logs generated from monitored devices.
Also, network monitoring can help with detecting intrusions on a network such as the one caused by a worm that consumes most of the network bandwidth.
Even though network monitoring can be done manually, it is usually easier and more effective to use tools that have been specifically created for such purposes.
With so many tools out there, we compiled a list of some of the popular monitoring options and have reviewed them below.
Here’s the Best Server Monitoring Software & Tools of 2026:
1. SolarWinds Server Application Manager (SAM)
An industry leader in software and networking tools, SolarWinds offers an extensive suite of more than 60 enterprise IT tools including the Server Application Manager (SAM).
SAM monitors your applications and their supporting infrastructure on-site, in the cloud, or in a hybrid environment.
With SAM you can monitor hardware and cloud instances, perform capacity forecasting, and even manage asset inventory.
If your systems are in the cloud, SAM can monitor applications via an agent, agent-less, and/or by using information from your cloud providers API’s.
We Highly recommend this product as its specifically designed to granularly monitor, analyze and help you dial in your DB queries and trim those execution times way down.
Key Features:
- Monitor Azure and AWS IaaS, PaaS and SaaS
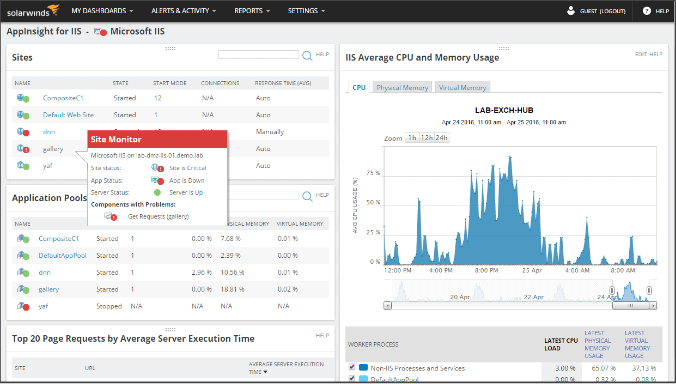
- Deep Monitoring of Microsoft Exchange, IIS, and SQL Server with the built-in AppInsight templates.
- Exchange: See mailbox storage and database status, monitor user activity, and identify any replication issues.
- IIS: Monitor, websites and application pools, SSL certificate expiration, and perform remote actions including starting/stopping application pools.
- SQL Server: Monitor sessions, connections, disk I/O, Latches, database transactions, and more
- VMware and Hyper-V health monitoring and availability – integration with SolarWinds Virtualization Manager for deeper insights to troubleshoot virtualization issues.
- 200+ supported applications including Active Directory, Java, XenApp, IBM WebSphere, Skype for Business, Office 365, and more!
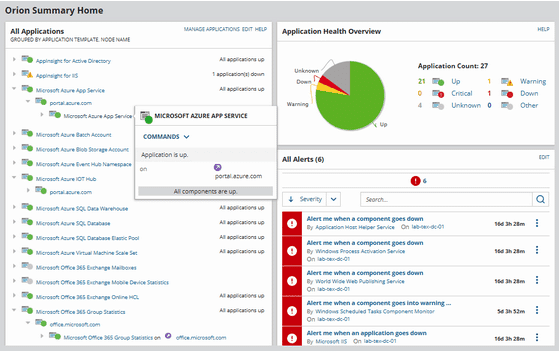
- AppStack Dashboard allows you to perform application infrastructure dependency mapping. With this you get a contextual view of how applications such as virtual machines, servers, and storage systems are linked to other components within the IT Infrastructure.
- PerfStack dashboard gives you the ability identify and resolve problems with Cross-Stack IT Data Correlation. You can compare data such as network interface utilization, application performance, memory utilization of your VM host, storage IOPS, and more.
- IT Asset Inventory Management with customizable properties including warranty information, SKU’s, Serial Numbers, PO numbers and purchase prices.
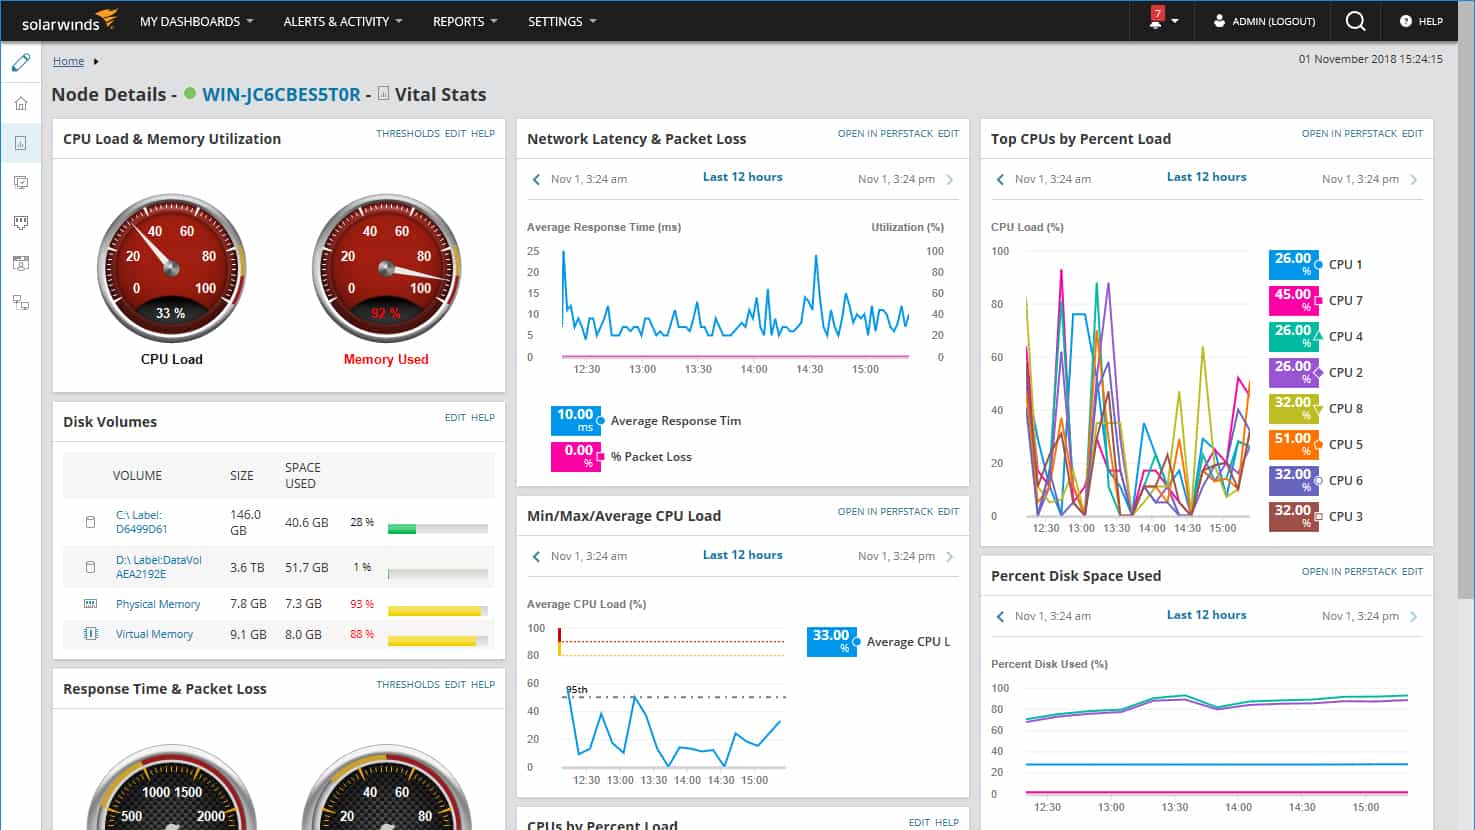
- Server Performance Monitoring for multi-vendor server infrastructures such as HP, Dell, IBM, and more.
- Keep track of disk space, CPU and memory and more.
- Remotely work on server issues including starting/stopping/rebooting servers.
- Monitor hardware health on multi-vendor physical and virtual servers including start/stop times, response times.
SolarWinds SAM is able to monitor almost anything both virtually and on-premise, making it a top choice for organizations and IT professionals!
Pricing:
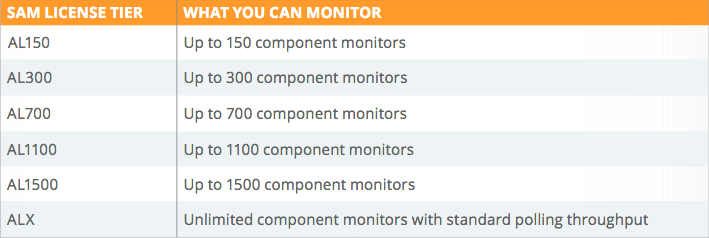
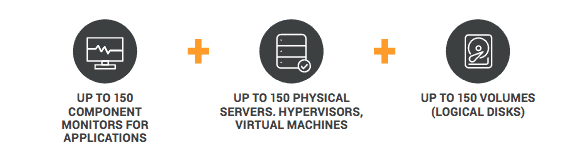
SolarWinds SAM is based on a licensing model depending on the number of components being monitored.
For each licensing tier, you are able to monitor physical servers, hypervisors, an disk volumes, at no additional cost.
Download a Fully Functional 30 Day Trial Here.
30 Day Free Trial Available! Download Below!
Website & Download Links
https://www.solarwinds.com/server-application-monitor
2. SolarWinds Network Performance Monitor (NPM)
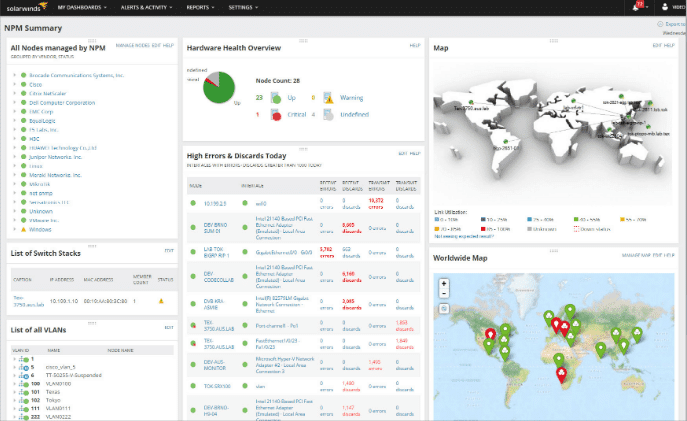
Solarwinds Network Performance Monitor is designed to enable you to quickly detect, diagnose and resolve network performance issues and outages.
With a powerful tool like SolarWinds NPM, you can correct issues quickly and even prevent them, increasing service levels and reducing downtime with multi-vendor monitoring.
The Cisco ACI feature allows you to measure the health of your logical and physical network.
Other notable features include; Critical hop-by-hop analysis, cross-stack network data correlation, and advanced network insight features and dashboards.
Key Features:
- Customizable Topology and intelligent alerts to help you respond to different types of events including, correlated events, condition checks, and device dependencies.
- Dynamic network mapping and discovery for managing performance metrics, wireless coverage and link utilization.
- Customizable reports allow you to do capacity forecasting and setup alerts and thresholds based on peak and average usage.
- With Cisco API Support, you can monitor logical components of the SDN environment.
- Intelligent maps gives you the ability to get to the root of complex issues faster by allowing you to visualize data in different forms.
- Monitoring for Advanced network devices such as F5 BIG-IP load balancers, Cisco ASA, Palo Alto Networks, and Cisco Nexus switches.
- Hardware health monitoring
- Easy to use and 30 day Free Trial available.
Pricing:
Download a Fully Functional 30 Day Free Trial of SolarWinds Performance Monitor Here!
30 Day Free Trial Available! Download Below!
Website & Download Links:
https://www.solarwinds.com/network-performance-monitor
3. SolarWinds FREE Server Health Monitor
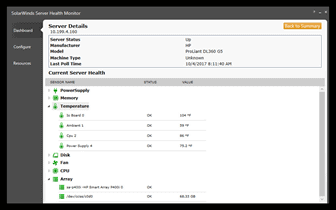
SolarWinds Server Health Monitor is a FREE tool to help you gain insights into the health of your hardware and server and alerts you to make sure you know what is going on.
With this tool, you can monitor the hardware health of up to 5 multi-vendor servers.
If you have more than 5 servers, you can get the Server & Application Monitor that starts at $2,995.
Key Features:
- Monitor hardware status and performance on up to 5 servers
- Get alerted on critical information such as fan speed, temperature, power supply, battery, CPU and more.
- Monitor Dell PowerEdge, HP ProLiant, IBM eServer xSeries servers, and VMware ESX/ESXi hypervisor.
- Supports SNMP, WMI, and CIM
Pricing:
100% Free for LIFE!
Website & Download Links:
https://www.solarwinds.com/free-tools/server-health-monitor
4. SolarWinds Storage Performance Monitor
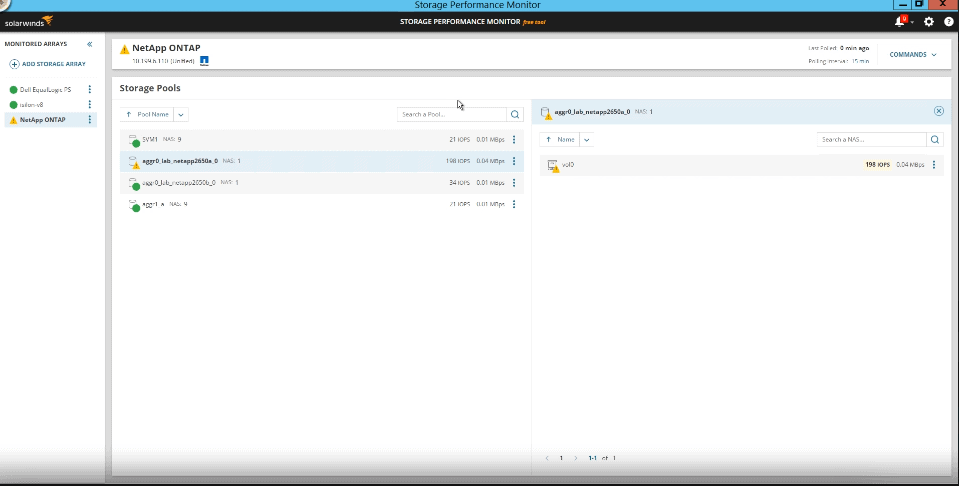
Another great free tool by Solarwinds, the Storage Performance Monitor gives you the ability to monitor storage for a few multi-vendor systems.
With this Free tool, you can monitor IOPS, set customizable thresholds, and be alerted when these thresholds are exceeded.
For larger and more complex networks, you can get the Solarwinds Storage Resource Monitor which is a full feature version of this free tool and starts at $2,995.
Key Features:
- Storage I/O host-spot detection
- Limited set of multi-vendor storage arrays
- Customizable metrics
- Threshold exceeded warnings
- Custom polling and discovery intervals
Pricing:
100% Free for Life!
Website & Download Links:
https://www.solarwinds.com/free-tools/storage-performance-monitor
5. SolarWinds Exchange Monitor
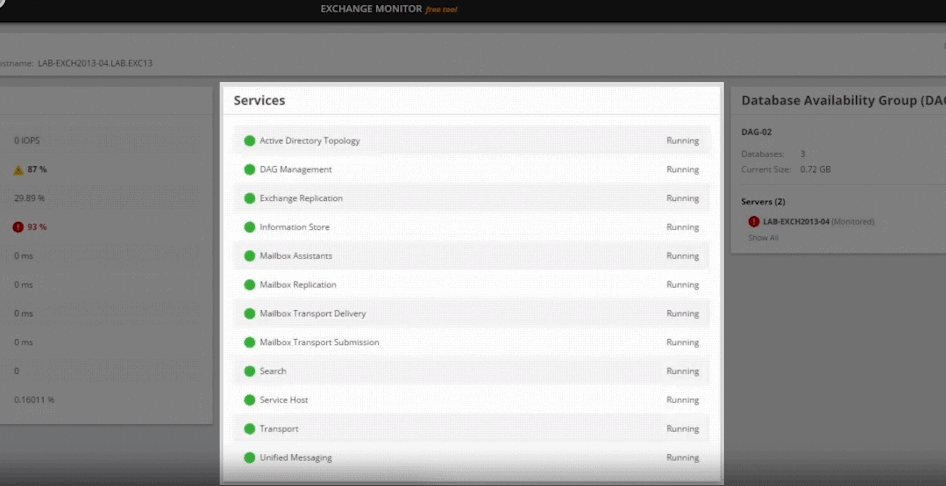
If you have an exchange server and are interested in monitoring it’s overall health and performance, then this FREE tool by Solarwinds is a must!
With Solarwinds Exchange Monitor, you can monitor and get alerts on performance, availability, capacity and more.
For more advanced features, get the Solarwinds Server & Application Monitor starting at $2,995.
Key Features:
- Monitor status and health of multiple Exchange Services
- Windows and Exchange key performance metrics
- Monitor Database availability
- Customizable thresholds and alerts
Pricing:
100% Free!
Website & Download Links:
https://www.solarwinds.com/free-tools/exchange-monitor
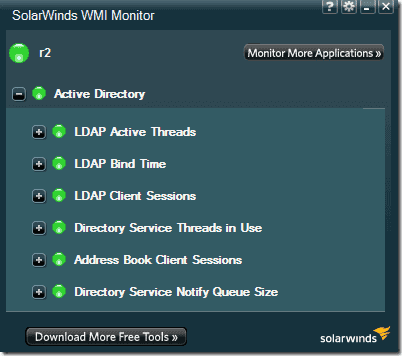
6. SolarWinds WMI Monitor
Can you tell we love Solarwinds Products?
Here is yet another Free Solarwinds tool worth mentioning if you are in need of WMI monitoring.
The WMI Monitor gives you the ability to see real-time performance metrics on any Windows Server and it gives you a bunch of pre-built and community sourced templates.
Keep in mind that this only monitors WMI for ONE server. For more complex systems and larger networks, you can get the Server & Application Monitor starting at $2,995.
Key Features:
- WMI Monitoring for one server
- Built-in WMI browser allows you to design scripts
- Pre-built templates or community-sourced templates can be accessed on THWACK for use
Pricing:
100% Free!
Website & Download Links:
https://www.solarwinds.com/free-tools/wmi-monitor
7. SolarWinds Database Performance Analyzer (DPA)
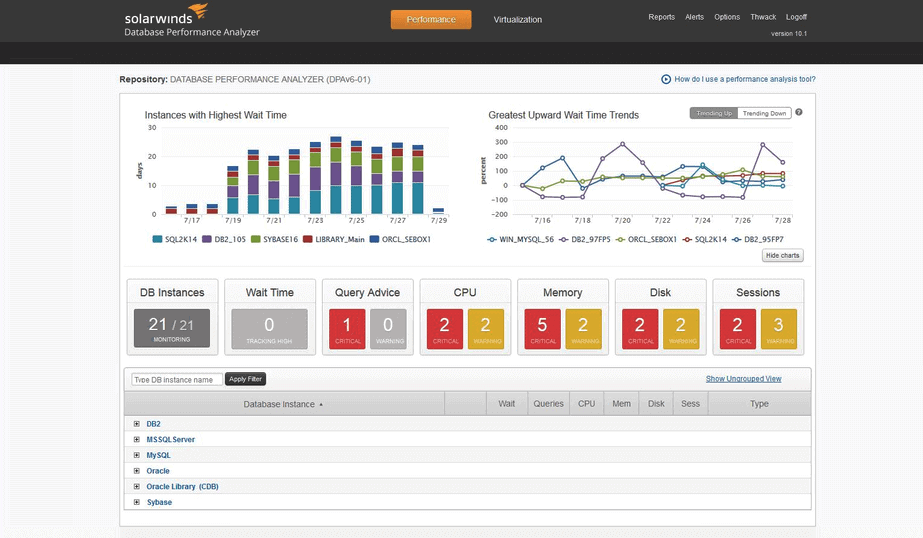
Solarwinds DPA monitors and analyzes your SQL database instances to solve bottlenecks.
It uses a Response Time Analysis method to focus on the time between query requests and the response from the database, and analyzes wait types and events to pinpoint issues before they get out of hand.
Something we love about Solarwinds DPA is its easy to use interface that makes finding and resolving issues quick and easy, within the first screen, as seen below:
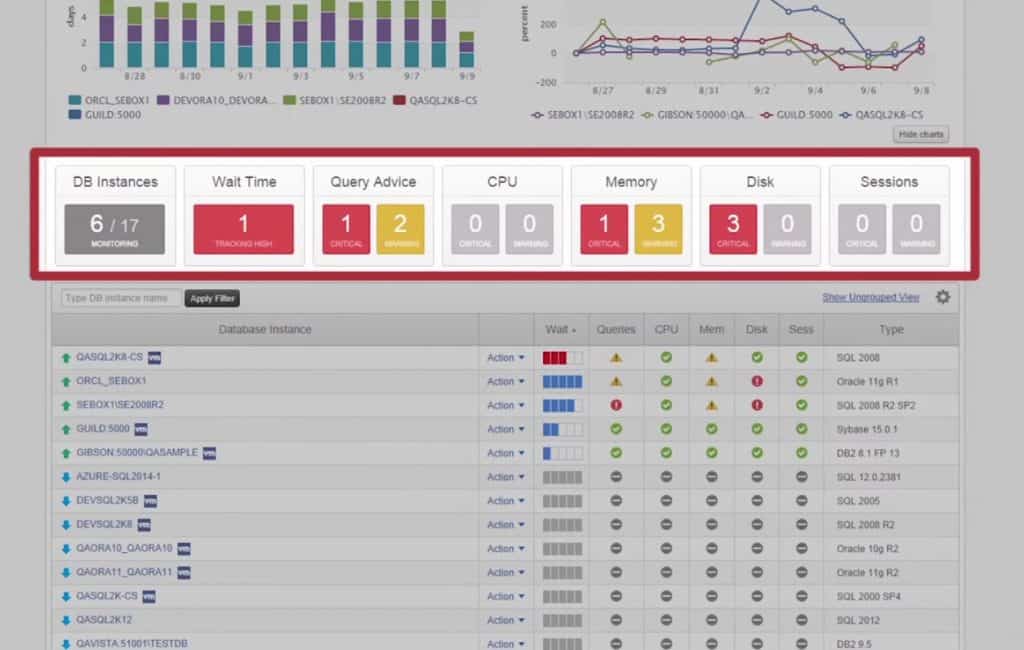
Right on the main screen you are able to view DB Instances, Wait Times, Query Advice, CPU, Memory Alerts, Disk, and Sessions.
Another notable feature worth mentioning is how the system drills down to go deeper into an issue.
For example, the Trend dashboard shows you Total Wait Times for users over the course of a month, split up by days. You can drill down into the data by Day, Total, Wait, Average Wait and more.
It will give you data down to the minute!
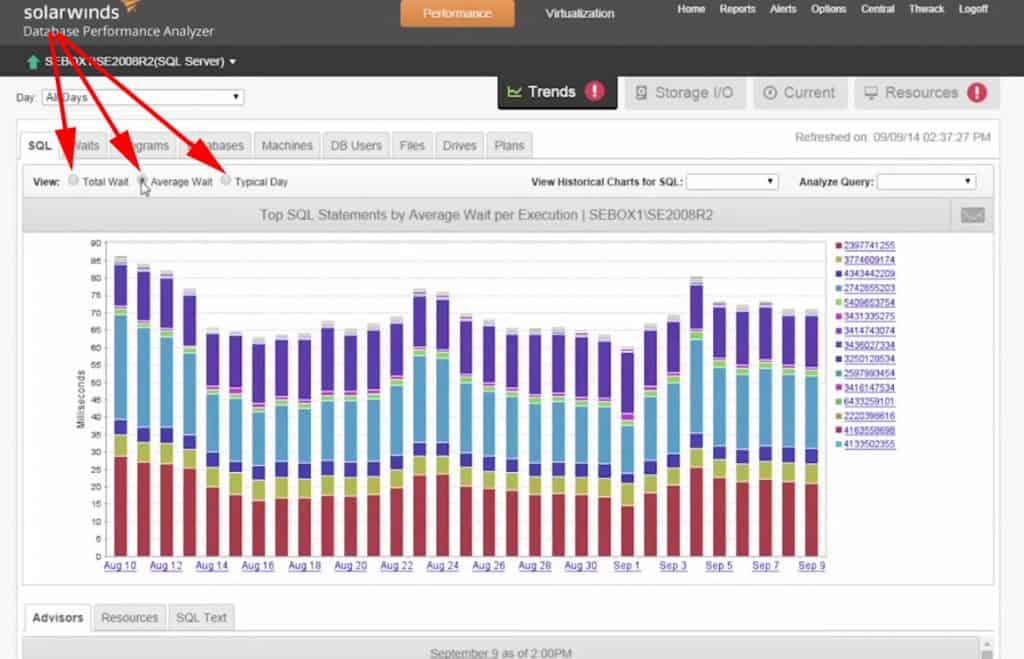
We highly recommend this product because it is specifically designed to monitor, analyze and help you dial in your DB queries at a granular level, in turn helping you trim those execution times way down.
Key Features:
- Database engines: SQL Server, Oracle, MySQL, DB2, SAP ASE, Cloud
- Database Tuning Advice to enhance Performance – DPA gives you advice for tuning individual DB instances to ensure its running at its peak performance by analyzing all parameters of an instance and recommending a course of action to optimize certain queries or database instances for peak performance.
- Active monitoring of all Active sessions to the Second – Highly Detailed native Polling Engine records exactly everything that is happening within your database instances with no additional load to the database themselves.
- Tracks, Monitors and analyzes databases components to pinpoint root problems of performance issues – Automatically Correlates queries, users, files, plans, objects,wait times, storage and date/time/hour/minute to accurately discovery and diagnose problems on the fly.
- Single point of Monitoring for all your Database instances and types of DB’s – Supported Database software includes: Oracle, SQL Server, MySQL, DB2, and ASE, either physical in-house, Virtual Machines (Vmware/Hyper-V) and in the Cloud DB’s.
- Agentless and Highly Scalable – Monitor as many Database instances as you want – from 1 to 1000 instances. Its highly scalable and Agentless.
- Integrates easily with Solarwinds Orion Platform – Use Solarwinds SAM (Server and Application Monitor) to view database information including Nodes and Applications.
Pricing:
Pricing starts at $2,045 and you can get a quote here.
Website & Download Links:
https://www.solarwinds.com/database-performance-analyzer
8 . ManageEngine OpManager
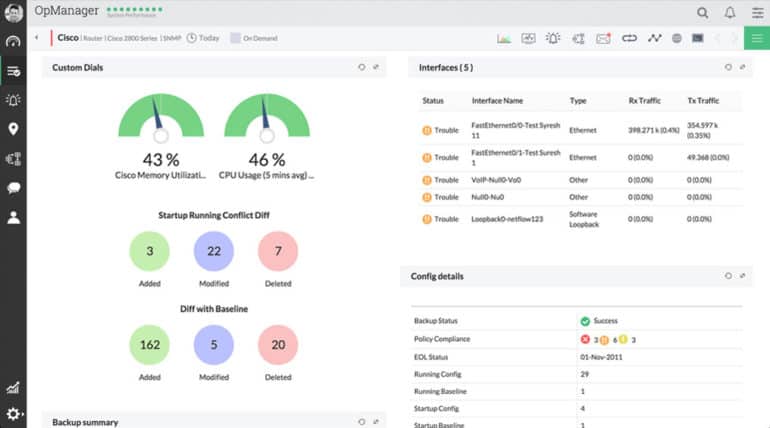
If you are managing a network of computers, servers, routers and other network devices, you surely have a lot of monitoring tools to pull up to have an overall visibility of your network’s performance.
OpManager boasts a do it yourself deployment, not requiring any setup or consultation fees that software manufacturers so often like to provide as a “necessary” service.
Once installed, it instantly goes to work with its automatic network discovery, able to discover over 15,000 interfaces in just one minute.
This truly integrated network management software is one of the leading network management tools on the market.
Some notable features include network and server monitoring, bandwidth analysis, firewall log management, configuration management, IP address and switch port management, and fault management.
ManageEngine’s OpManager application is a full-service suite of services and features for network administrators, providing the ability to manage and monitor networks better than ever before.
Instead of piecing together multiple expensive, smaller applications that only do one thing at a time, OpManager combines the best of all into one, powerful, simple-to-install and easy-to-use interface.
Key Features:
- Network Performance Monitoring
- Router Monitoring
- Switch Monitoring
- WAN RTT Monitoring
- VoIP Monitoring
- Network Mapping
Pricing:
30 Day Free Trial Available!
- Standard Edition
- $245 (10 Devices)
- 1000 Devices Count
- Limited features within Discovery, Monitoring, User Management, Dashboards, Maps, Fault Management, 7 Days Raw Data Maintenance
- Professional Edition
- $345 (10 Devices)
- 1000 Devices Count
- Full Functionality of all features: Discovery, Monitoring, User Management, Dashboards, Maps, Fault Management, 60 Days Raw Data Maintenance
- Enterprise Edition
- $11,545 (250 Devices)
- 10,000 Devices Count
- Full Functionality of all features: Discovery, Monitoring, User Management, Dashboards, Maps, Fault Management, 180 Days Raw Data Maintenance
Plans can also be customized to fit your needs and you can request a custom quote via the link below.
Website & Download Links:
https://www.manageengine.com/network-monitoring/opmanager-editions.html
9. Zabbix
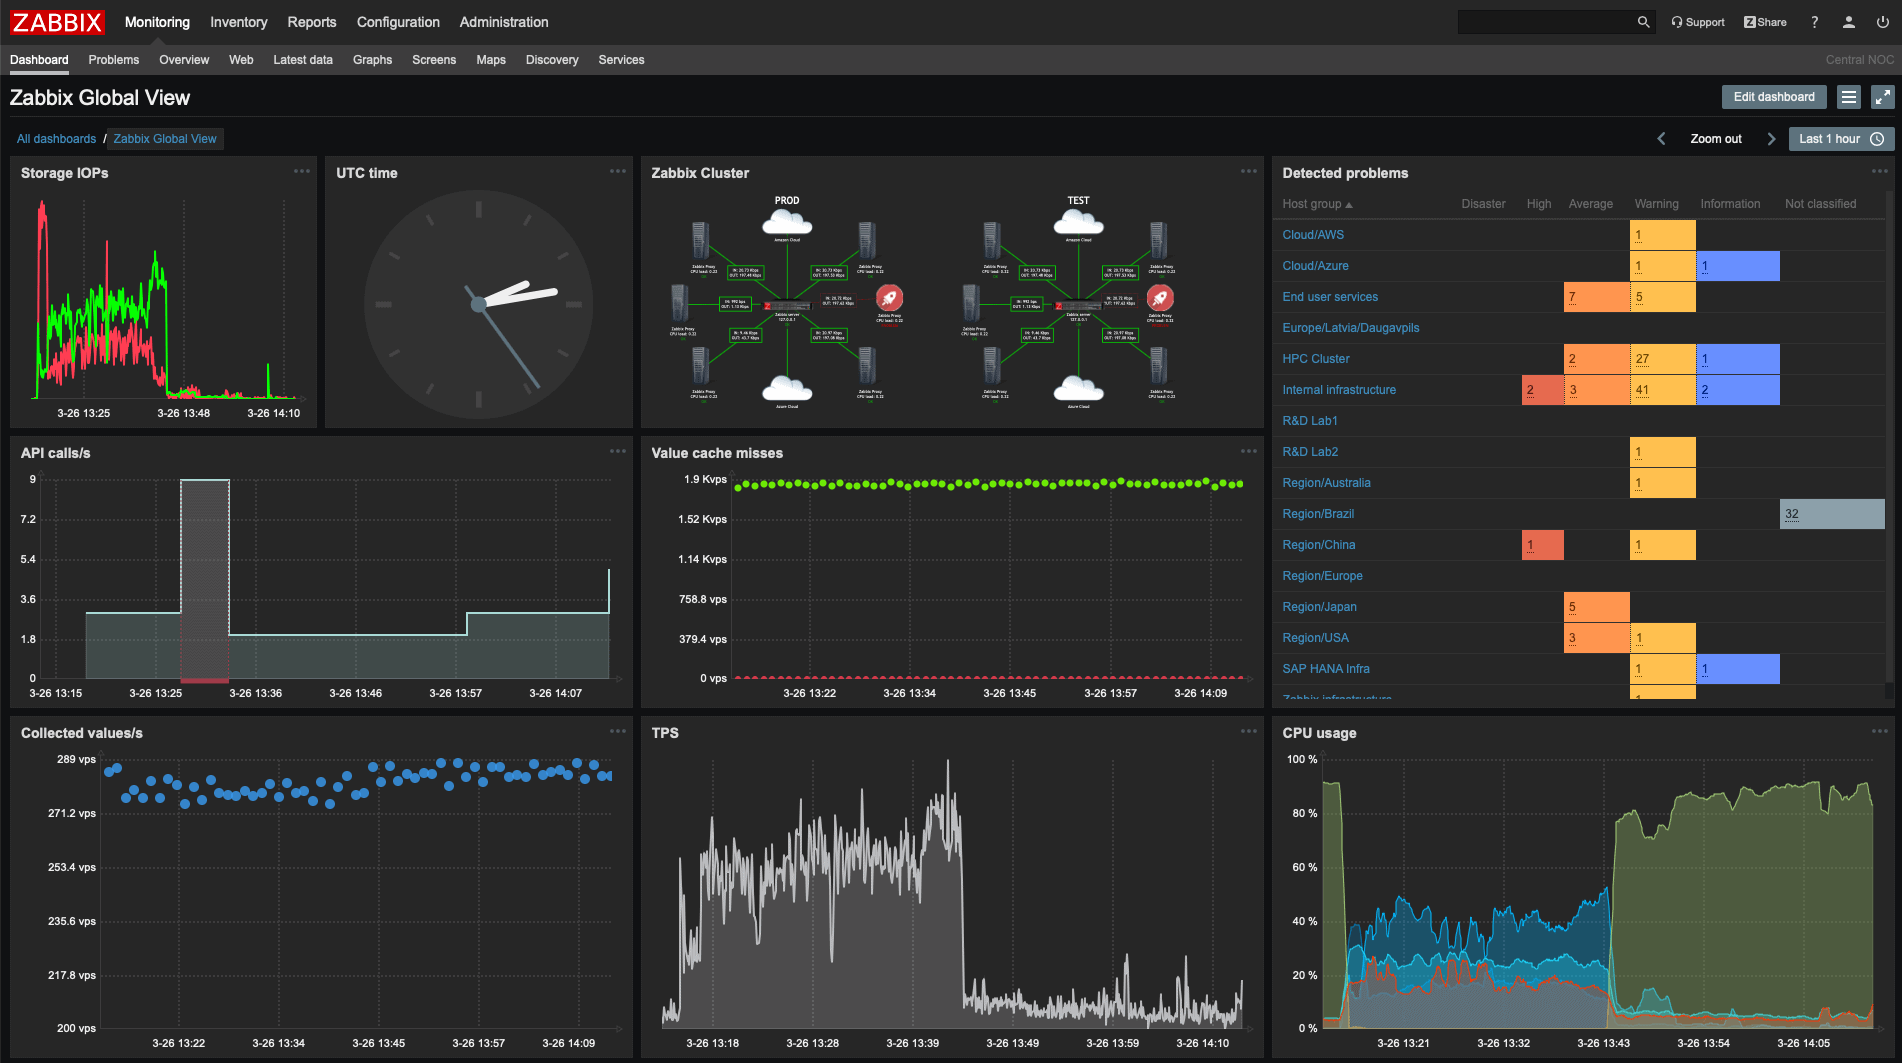
Zabbix’s slogan is “monitor everything” because they offer solutions for any kind of IT infrastructure and their monitoring includes: network monitoring, server monitoring, cloud monitoring, application monitoring, services monitoring.
Zabbix is not too shabby for being Free, Open Source and Web-based and can handle enterprise-grade networks.
Some notable features include the Zabbix Agent which allows you to monitor and plan capacity expansion with some pretty great, and in-depth utilization metrics.
Zabbix also has a pretty decent notification and alerting module as well as an easy-to-use interface.
It is known for it’s easy and quick download and great online support tools should you need help with the system.
Key Features
- Types of monitoring include: network monitoring, server monitoring, cloud monitoring, application monitoring, services monitoring.
- Widget based dashboards with multiple view options.
- Web-Based
- Zabbix Agent to help with capacity planning and monitoring.
- Notification and Alerting system.
- GUI Interface
- Nice reporting system includes graphs, slideshows, drill-down reports, and more.
Pricing
100% Free and Open Source!
Website & Download Links
https://www.zabbix.com/download
10. IPSwitch WhatsUp Gold
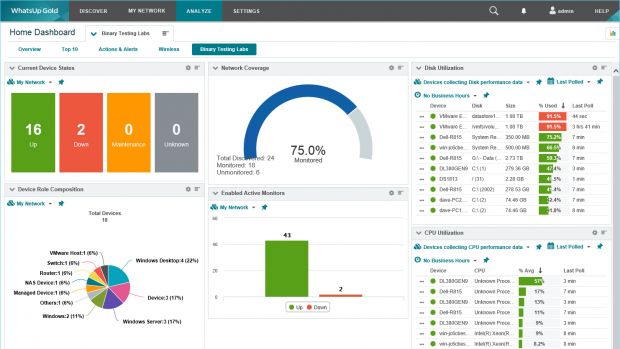
WhatsUp Gold 2019 (latest version) is a Network Monitoring and Performance tool capable of sending alerts and generating reports based on application, host, and network status, and more.
With the release of the new 2019 version, some new and improved features include their Virtual Map Overlay supporting Hyper-V and VMware, Heat Maps, Storage Monitoring, imporoved automatic discovery and mapping of all resources, Slack Integration, and more!
Key Features
- Types of Monitoring: Network Device and Server Monitoring, Availability & Performance Monitoring, Wireless Network Monitoring, Cloud & Storage Monitoring, Application Monitoring, Virtualization Monitoring, Hyper-V and VMware virtual monitoring
- Auto Discovery
- Application Monitoring – create your own or use out-of-the-box monitoring solutions.
- Alerting Features – fully customizable alerting system including separate warning and down states, define critical and non-critical alerts and more.
- Reporting Features – get data on the health of all applications, current statuses, and fine tune the data with their customizable reporting system and dashboards.
- Rest API
Pricing
Free Trial Available!
Pricing starts around $1,755 and goes up from there based on a custom quote within the following plan types:
- Premium Plan
- Annual Subscription
- Comes with: Monitoring, Automatic Discovery, Interactive Map, Customizable Dashboards & Reports
- Request Custom Quote
- Premium License
- Devise Based License
- Comes with: Monitoring, Automatic Discovery, Interactive Map, Customizable Dashboards & Reports
- Request Custom Quote
- Total Plus
- Point Based License
- All features included
- Request Custom Quote
Website & Download Links
https://www.ipswitch.com/forms/request-a-quote/whatsup-gold
11. Nagios Core and Nagio XI
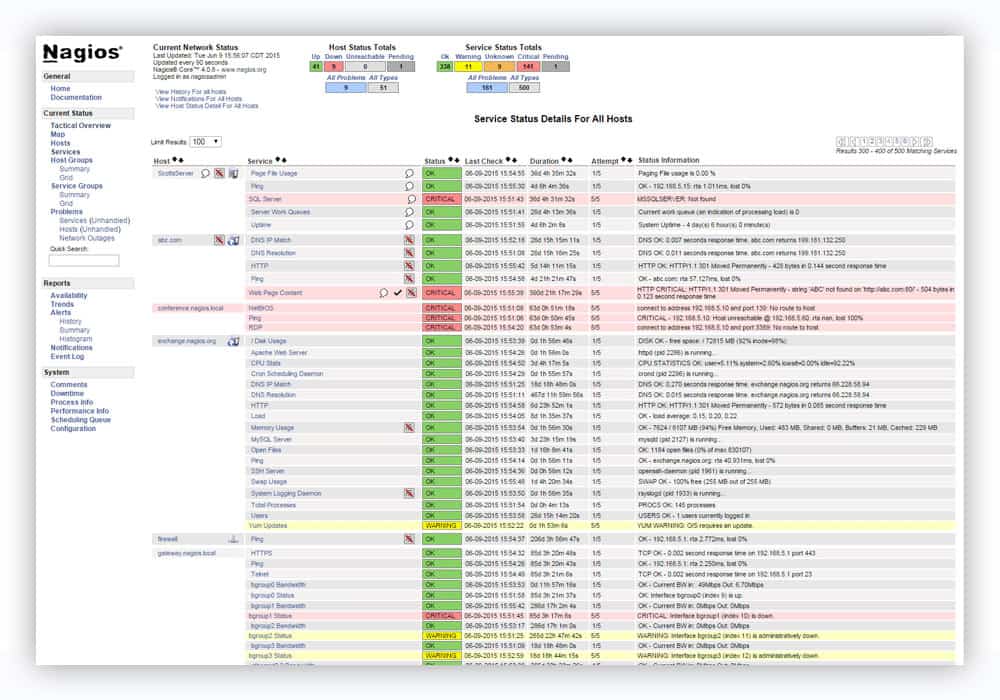
Nagios offers enterprise-class network monitoring solutions and their products include Nagios Core and Nagios XI.
Nagios Core is the lower-end version of the two and is offered at a cheaper price.
With Nagios Core, you can monitor: servers, network elements, applications, system metrics, and custom services.
You also have email, mobile and custom alerting capabilities as well as basic reports.
For smaller sized networked, Nagios Core can handle the basics of network monitoring just fine.
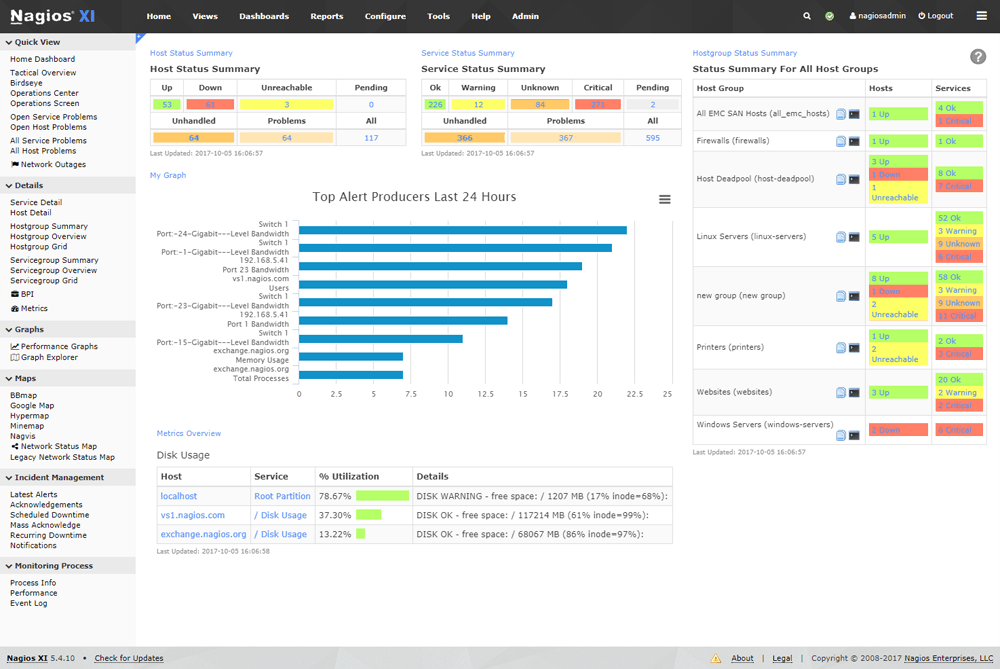
For more enterprise-level needs, Nagios XI is the better choice of the two.
With Nagios XI, you get everything Nagios Core has plus Advanced reporting including SLA reports, User-specific and customizable dashboards, instant remote host access, performance graphs, and so much more.
Key Features:
- Monitor – servers, network elements, applications, system metrics, and custom services.
- Alerting – E-mail, Mobile, Custom, RSS, Per-User Notifications.
- Reporting includes out-of-the-box basic reports, Performance graphs, SLA Reports, Email reports, Capacity planning, and more.
- User Interface with customizable options such as user-specific customizations and dashboards, remote host access, custom actions, sharable/deploy-able dashboards, branded interface capabilities and more.
- Distributed Monitoring
- Network Maps
Find a full Nagios Core vs. Nagios XI Feature Comparison here.
Pricing:
Free Trial Available!
Website & Download Links:
13. Spiceworks Network Monitor
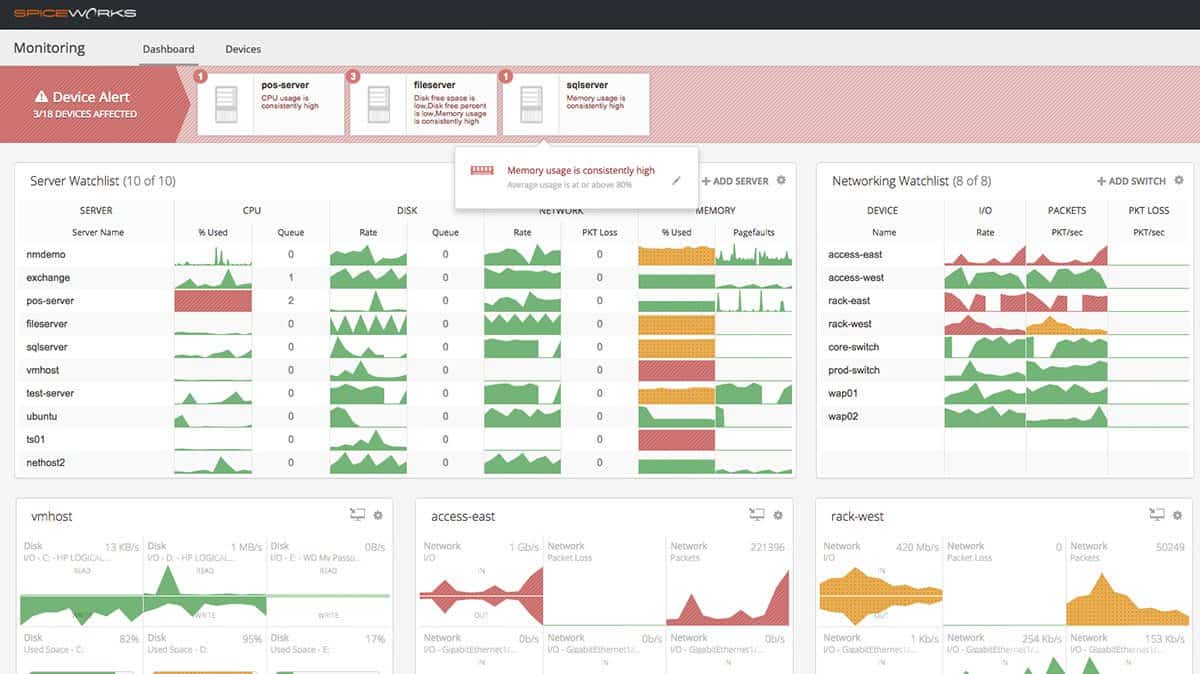
Spiceworks Network Monitor is a Free, cloud-based tool designed for companies monitoring fewer than 25 devices.
With this tool you can get real-time updates on servers, switches, and any IP device.
You can receive alerts when any servers, switches or IP devices show signs up outages or issues.
For smaller companies and individuals, this is a great, free way to monitor your network
Key Features:
- Real-time network monitoring
- Easy to use and Free
- Web Based
- Android App
- Small – Medium sized businesses
- Knowledge Base
Pricing:
100% Free!
Website & Download Links:
https://www.spiceworks.com/it-articles/network-monitoring/
14. Ganglia
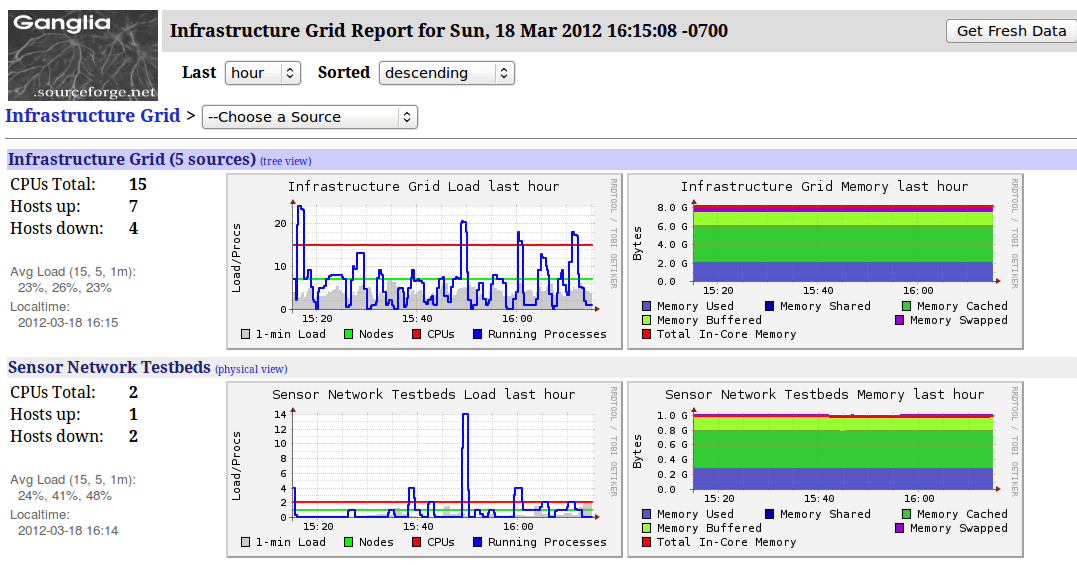
Ganglia is a free, open-source (BSD License) networking monitoring tool designed especially for high-performance computing systems such as clusters and Grids.
It’s a solid monitoring platform that supports many operating systems and processors but we recommend it for those with a stronger IT background in order to use it’s full potential.
Key Features:
- Open Source
- Uses XML for data representation, XDR for compact, portable data transport, and RRDtool for data storage and visualization.
- Network Monitoring
Pricing:
100% Free and Open Source!
Website & Download Links:
http://ganglia.info/?page_id=66
15. CollectD
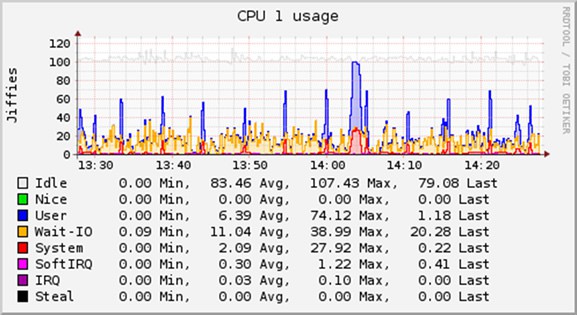
Commonly used to find performance bottlenecks and monitor/predict system load time, CollectD is another Free and Open Source tool.
It collects basic system performance statistics over time and stores the data in RRD files that Cacti and graph data.
DevOps engineers most commonly use this tool in conjunction with graphing tools such as Grafana, Cacti or Graphite.
Key Features:
- Written in C++ and is available for multiple operating systems.
- Comes with over 100 plugins
- Built to Scale
- SNMP Support
- Integration with monitoring solutions
Pricing:
100% Free and Open Source!
Website & Download Links:
16. Cacti
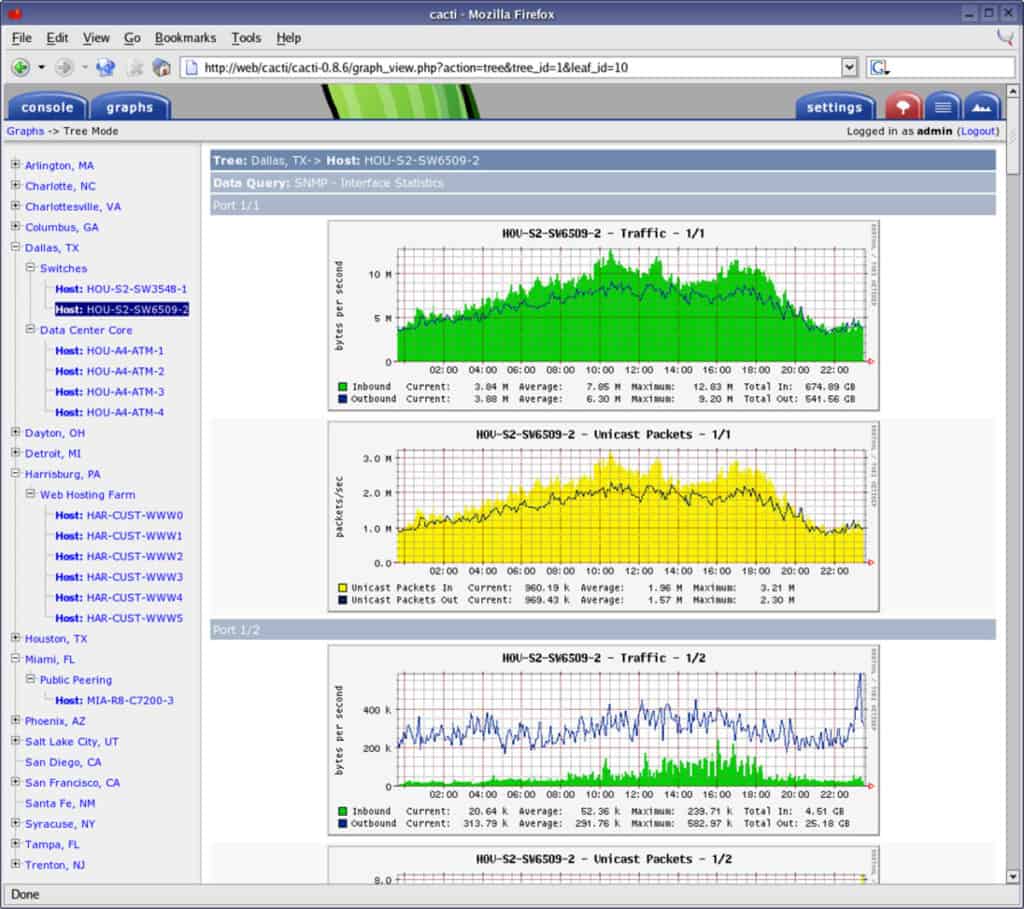
Cacti is a Free and Open Souce monitoring platform that will quietly capture data on your network without any real intervention from a human operator.
It has many useful features, such as an unlimited graph creation tool, which means that you can monitor as many specific targets on the network as you like, by utilizing data sources and SDEFs from within the application itself.
Graph sequencing can also be accomplished through the application, allowing you to create a custom monitoring zone for easy viewing.
Key Features:
- WMI ICMP SNMP
- DB Funcionality and Alerts
- Hardware Monitoring
- Web Server Monitoring
- Reports and Graphs of Historical Trends
Pricing:
100% Free and Open Source!
Website & Download Links:
https://www.cacti.net/download_cacti.php
17. Icinga
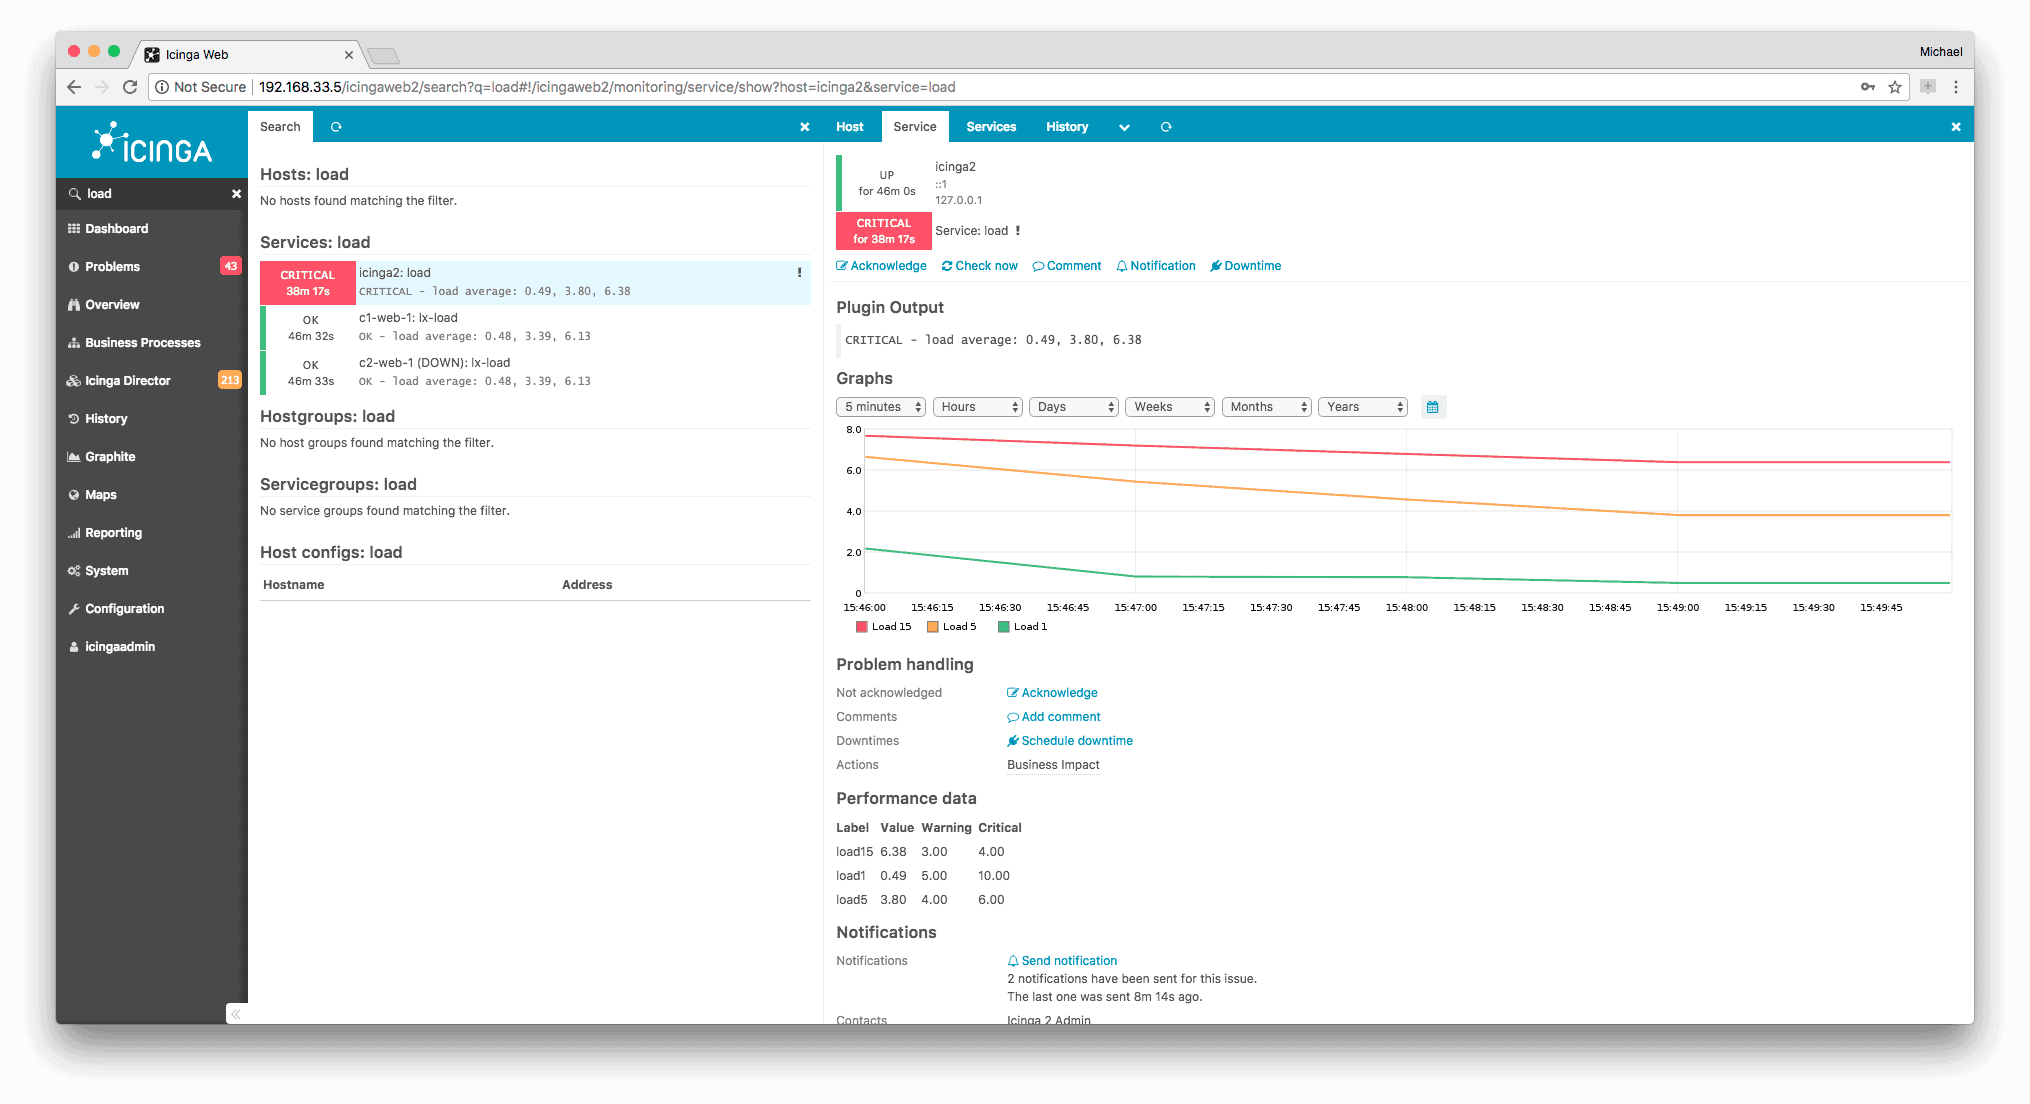
Icinga runs on most of the popular Linux distros and the vendor provides detailed installation instructions for Ubuntu, Debian, Red Hat (including CentOS and Fedora) and SUSE/SLES.
Icinga is a powerful monitoring tool with some great features and it is also Free and Open Source.
One notable feature is it’s ability to perform zone and cluster monitoring which allows the architect to build a hierarchy of monitoring systems.
Key Features:
- Rule Based configurations
- Performance monitoring including zone and cluster monitoring.
- Supports SNMP and direct monitoring
- Customizable dashboards
- Supports InfluxDB and Graphite natively
- Alerting system including text notifications
- REST API
Pricing:
100% Free and Open Source!
Website & Download Links:
18. OpenNMS
According to their site, OpenNMS is based around a “publish and subscribe” message bus. Processes within the software can publish events, and other processes can subscribe to them.
OpenNMS has been shown to be able to process 125,000 syslog messages per minute, continuously.
With this tool you can collect data, monitor networks and the tool integrates with trouble ticketing systems to seamlessly generate alerts and keep you updated on the status of your networks.
Key Features:
- Event Management and notifications – events can be configured to generate alarms and can integrate with a variety of trouble ticketing systems.
- Discovery and Provisioning –
- Service Monitoring
- Data Collection
- Web-based GUI interface
- Integration with JasperReports creates high level reports from the database and collected performance data.
Pricing:
Free and Open Source!
Website & Download Links:
https://wiki.opennms.org/wiki/Download
19. Paessler PRTG Monitor
PRTG is an all-in-one infrastructure monitoring solution with a sensor based platform which can scale on demand as your organization and needs grow.
Thia makes it suitable for both small and enterprise size businesses.
“Sensors” are the basic monitoring elements and on average you need about 5-10 sensors per device.
With network, server and application monitoring all integrated in one products, you can pick the features you want to use.
The Auto discovery feature will detect and import any network connected device, allowing you to set the applicable sensors to that specific node or service, one by one or via the template engine.
With PRTG, at a glance you can check the current values for the CPU, memory and disk usage, scheduling alerts in the event an unexpected issue or failure should arise.
Key Features
- Built in alerting technologies such as push notifications, Slack Messaging, Email notifications, Syslog Messaging, Execute HTTP Action and more.
- Multiple user interfaces including their custom PRTG Desktop app.
- App for iOS and Androig
- SSL-secured local and remote access that can be used simultanesouly
- Failover tolerant monitoring
- Real time Maps and dashboards as well as a map designer to integrate all of your network components
- Distributed monitoring so you can monitor several networks in different locations (DMZ and LAN)
- Advanced, in-depth reporting including numbers, statistics, graphs and more.
Pricing
Free 30 Day Trial available.
Free download of PRTG which can monitor up to 100 Sensors for life.
- PRTG 500
- From $1600
- 500 Sensors
- 1 server installation
- PRTG 1000
- From $2850
- 1000 Sensors
- 1 server installation
- PRTG 2500
- From $5950
- 2500 Sensors
- 1 server installation
- PRTG 5000
- From $10,500
- 5000 Sensors
- 1 server installation
- PRTG XL1 – Best Value
- From $14,500
- Unlimited Sensors
- 1 server installation
- PRTG XL5
- $60,000
- Unlimited Sensors
- 5 server installations
Website & Download Links
https://www.paessler.com/prtg/pricing
Before choosing a network monitoring tool, you will want to consider your budget, network size and need.
If you are on a tight budget, starting with a free option might be best.
In our experience, the SolarWinds options are our top choice because they offer a solution for any type of organization and every budget.