SolarWinds is a software company based in Austin Texas where their global headquarters can be found.
They have 2,500 active employees around the globe, with 275,000 customers which span some 190 countries. SolarWinds is active primarily in the network and systems management spaces, making them an excellent choice for anyone that is looking to improve their monitoring and visibility capabilities within an organization.
The company was started in 1999 and has been developing different products since then.
One such product is SolarWinds’ SAM, or Server and Application Monitor.
In its simplest form it is a comprehensive server monitoring suite that also gives users the visibility that they need to run custom monitoring solutions for their infrastructure.
It is quick and easy to set up and is normally up and running in a few minutes once installed.
It allows you to monitor Azure, AWS IaaS, PaaS and SaaS, and is capable of monitoring applications that are common to most organizations.
There are already 1200 application monitoring templates that you can experiment with, making your learning curb that much easier.
For everything else there are servers, infrastructure and network monitoring, as well as application monitoring.

Server & Application Monitor Features
SolarWinds SAM is a comprehensive monitoring solution that gives you everything that you need to get a monitoring team up and running in no time.
The best part of the SAM suite of functionality is the sheer list of features that it has.
A brief list of features includes:
- The ability to get started typically in minutes
- Allows monitoring of Azure and AWS IaaS, PaaS and SaaS
- Comes with out of the box support with 1200+ application monitoring templates
- Create your own prioritized solution with customizable server monitoring
- It has infrastructure dependency mapping
- It allows you to visualize application dependencies
- It has advanced alerting and reporting
- Extremely helpful with virtual server monitoring and management
- Helps keep an eye on storage performance and health
Server Monitoring
SAM also gives you an amazing server monitoring capability with support for applications as well.
This means that you can monitor servers as well as the applications that they run from one single platform, potentially from anywhere.
This encompasses a few core capabilities as it now gives you the power to completely monitor your IT infrastructure.
Server monitoring is available for both Windows and Linux, so your mixed environment requirements are more than likely to be met with such a solution.
Again, this applies to both on premises devices as well as remote and cloud servers.
There is a heavy focus on Microsoft monitoring as it supplies all of the components that you need to holistically monitor servers as well as the applications that are present on the machines.
This includes monitoring for your hypervisors, IaaS, PaaS, SaaS, and other ‘As A Service’ styled services that you need in your organization.
Add to this the fact that you get decent cloud monitoring that gives you advanced alerting and monitoring capabilities, and you have a package that deserves a deeper look.
Application support is possible thanks to a simplified system that also provides prebuilt templates, which ships compatibility with over 1200 vendor applications.
This isn’t just limited to applications though, as Databases, infrastructure components and servers are all easily catered for with the preinstalled templates.
If you have more specific needs then you can just as easily setup your own monitor parameters to encompass any service, application or server that you need, all in just a few simple clicks.
The whole process usually only takes a few minutes.
Application Discovery and Server Monitoring
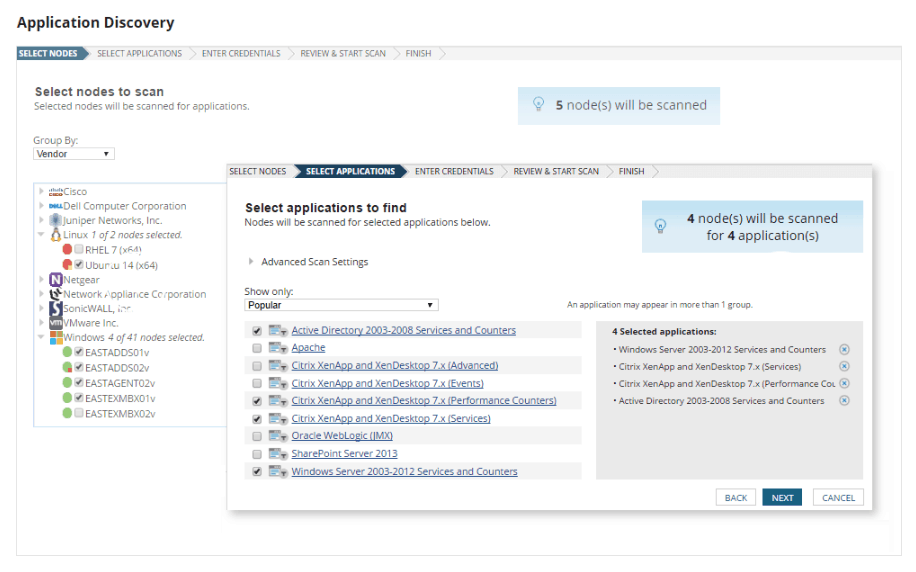
This is a really useful part of the system as it automates the discovery of applications.
This in turn means that setup of application monitoring is more reductive then additive, giving you the ability to exclude unwanted applications instead of chasing down the correct applications that you want to include.
This can save you a lot of time if you are trying to add several applications per server to your monitoring requirements.
The best part is that you don’t even need any professional assistance to get this up and running, simply run the application and allow it to start discovering all of the apps that you need to keep monitoring your current infrastructure such as servers and applications.
Azure and Amazon AWS service monitoring
This section allows you to accurately and easily monitor the many IaaS, PaaS and SaaS services that you have running on the popular cloud frameworks AWS and Azure.
The result is an end-to-end system performance monitor with added application monitoring support thrown in for good measure.
All of this is achieved through an agent-less technology that frees up additional resources on your target servers.
More about AWS Capabilities
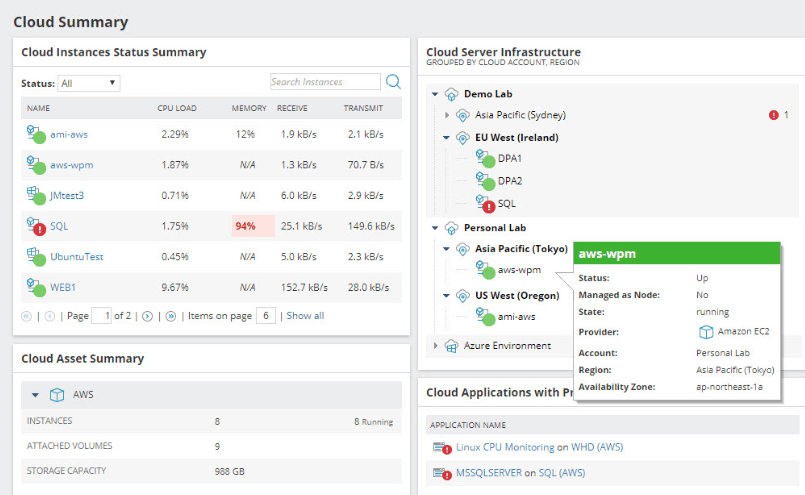
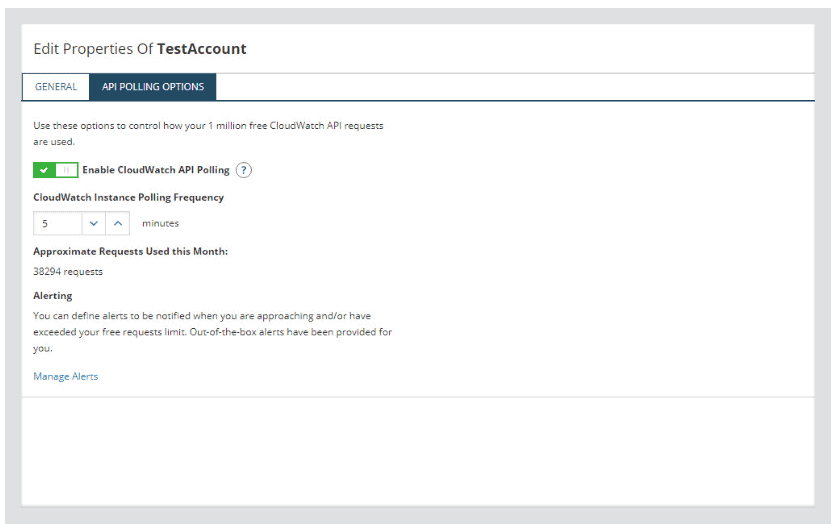
If you have access to your Cloud account, then you can allow the SAM application to directly query and poll APIs that have been built specifically for the cloud.
This gives you a lot of data in the form of metrics and status updates.
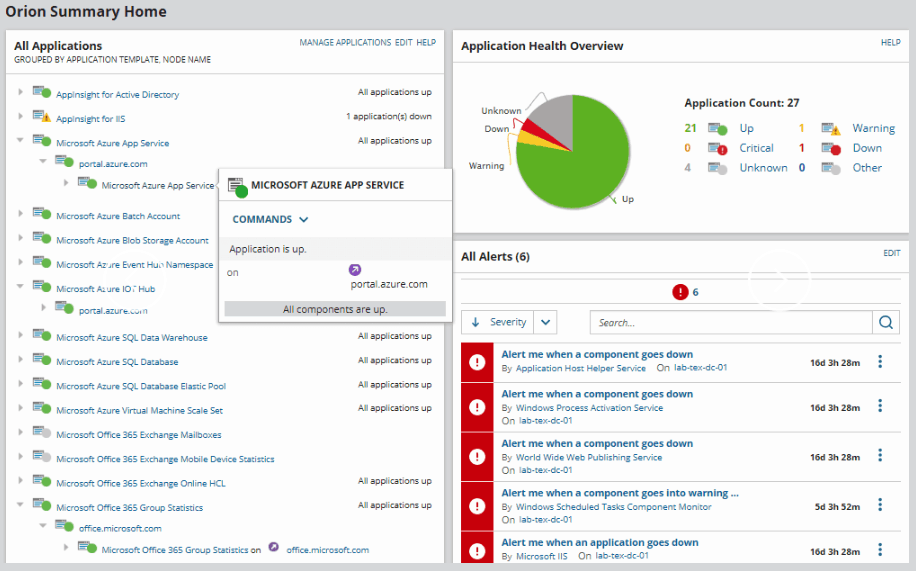
Whenever large data needs to be sorted aggregators are used to get a clearer understanding of the data, and SAM is no exception.
The data that is aggregated is then displayed via the Orion Web Console, giving you increased visibility.
Its core benefit is the fact that you can monitor troubleshoot and manage the varying types of issues that you are bound to encounter on a day-to-day basis with an AWS setup.
All data in the Orion Platform will populate immediately, giving you all the information that you need without having to deploy any additional AWS services.
Because cloud-based provisioning is expensive if not properly monitored, you will appreciate the automated nature of SAMS AWS scanning functionality.
Each new AWS component and instance that is added to your ever-growing list will be added. Monitoring AWS through SAM has never been easier, or more accurate.
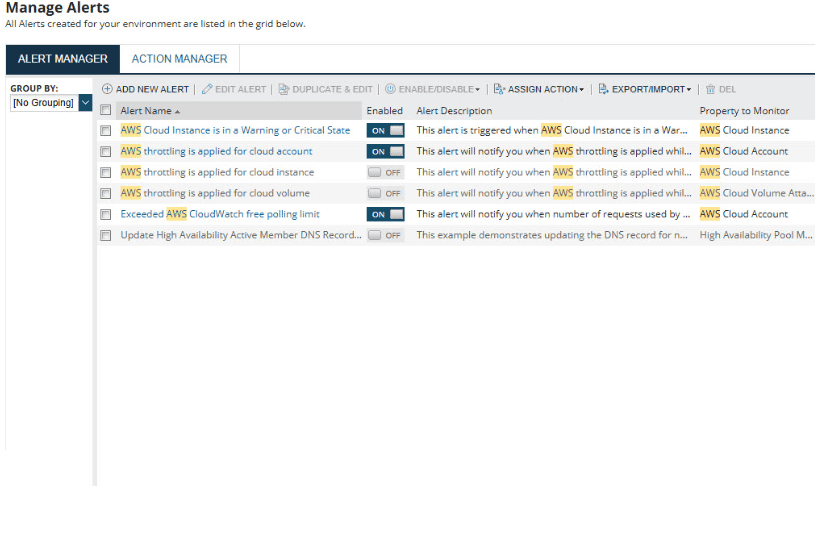
Cloud alerts are easy to configure and reveal important events such as AWS throttling, AWS limits exceeded, Orion cloud threshold issues, polling problems and cloud monitoring thresholds.
More on Azure Monitoring
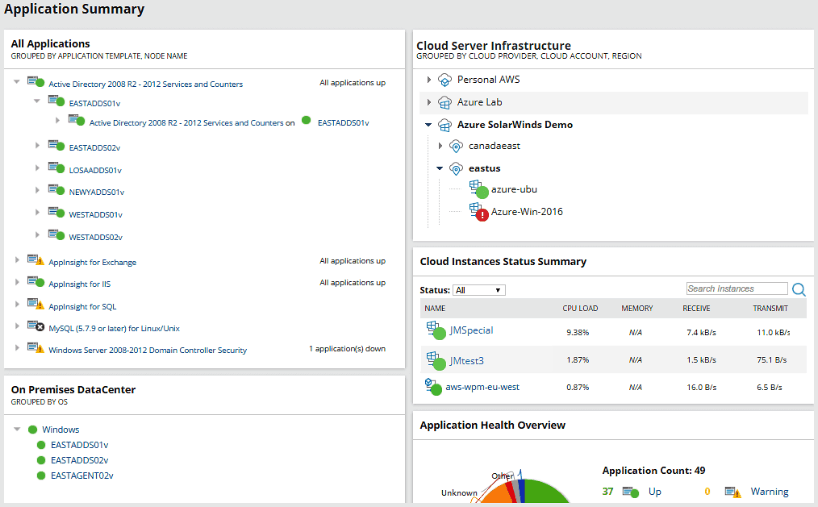
Through SAM Azure monitoring you can get an excellent overview of the performance of your setup.
It gives you the convenience od a single point of reference via its dashboard, and enables you to glean the most important factors of your installation such as system performance, application stability and infrastructure metrics such as uptime and performance.
All of these components can be based locally or in the cloud, giving you even more flexibility in your monitoring stack.
The system also gives you a powerful visualization tool because it allows you to correlate the performance metrics of all pf your systems across all of your platforms and environments.
The end result is a comprehensive snapshot of the current lay of the land regarding your IT infrastructure and cloud performance.
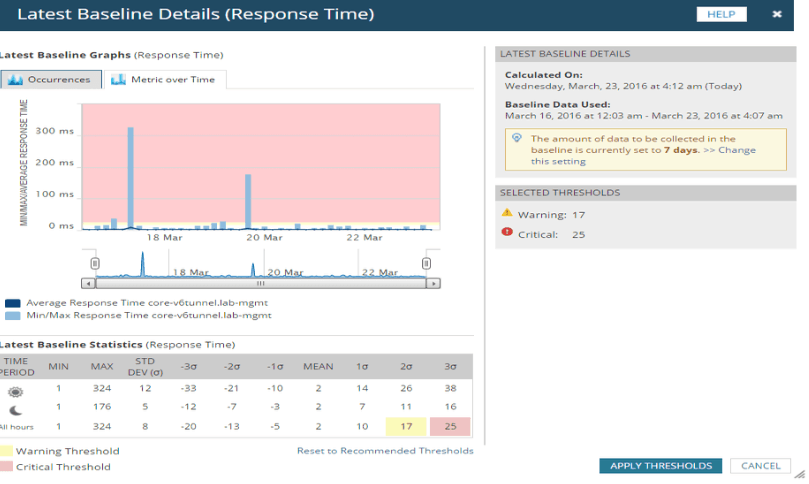
Other useful tools allow you to dynamically baseline your alerting structures so that you can peg out what the normal parameters of your setup should be.
These historical thresholds are invaluable when you are trying to determine which points your system needs to trigger an alert at.
The auto-discovery feature is also especially helpful as it ensures that Azure virtual machines and containers all get mirrored, which is critical if you need to ensure 100% uptime and disaster recovery steps.
SAM’s Azure cloud VM management features make monitoring your virtual environment much easier, giving you time to do more important things like manage local systems and administer your local accounts such as mail and user accounts.
Azure IaaS Monitoring
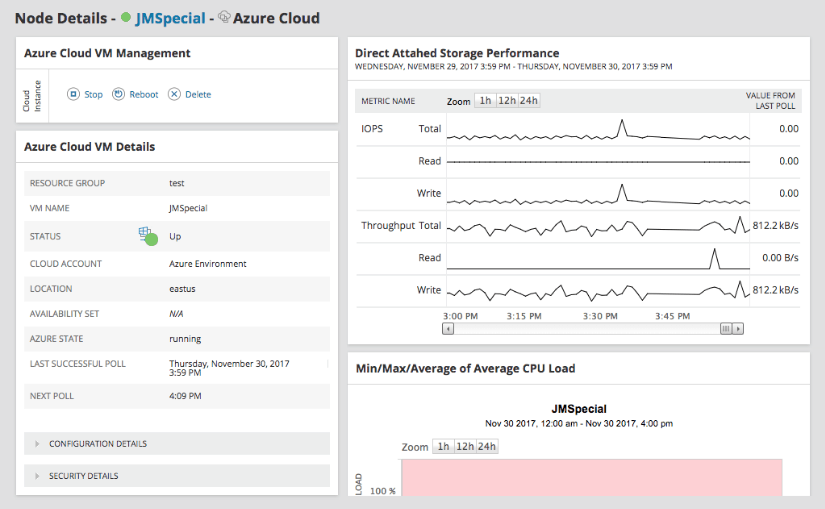
This feature helps you to keep track of the performance and reliability of your Azure services.
This helps you to view as well as correlate and explain certain trends within your infrastructure metrics data.
As with other SAM features, auto discovery plays a big role in finding new or undocumented VMs and containers.
SAM also monitors communications between VMs so that you can track and resolve suspicious activity, and make sure that only legitimate traffic is crossing between your various appliances and VMs within the setup.
The visual components of your dynamic mapping add another layer of practical monitoring, allowing you to fully understand the data in a graph.
You can shift these timelines to help identify trends and thresholds, and customization options allow you to check performance by region, configuration and security details settings.
Azure PaaS Monitoring
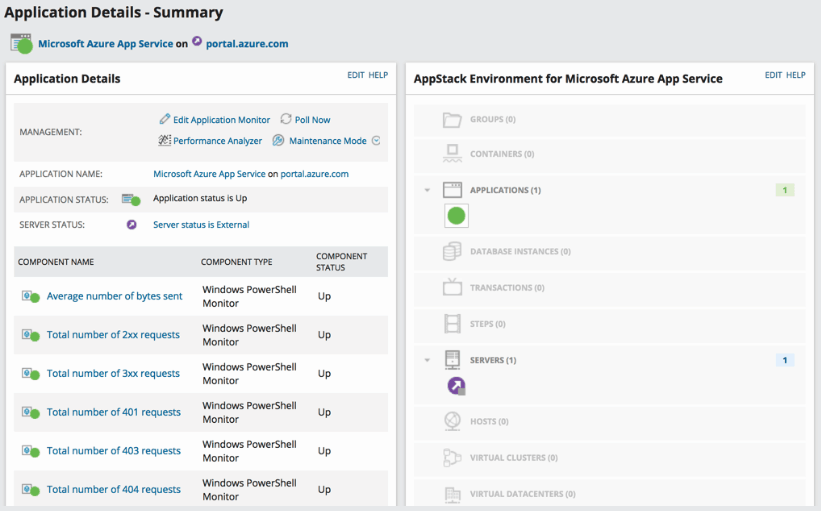
Tracking Azure PaaS services helps to ensure that application performance and availability is always looked at.
Components such as RAM, CPU and response times are all tracked through this feature, giving you critical insights into the way that your systems are running.
This all comes together to provide you with a foundational understanding of why your current setup is acting like it is. You can also view metrics for App Service, Event Hubs and SQL Database from here.
Office 365 Monitoring
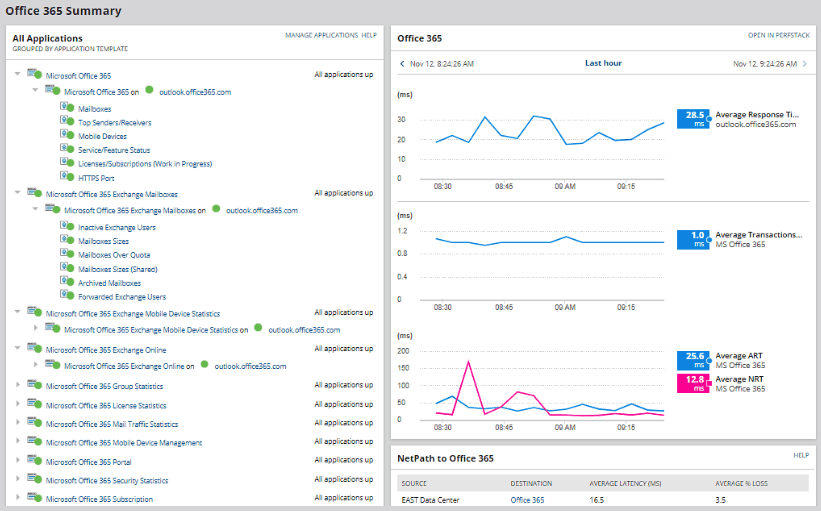
If your organization uses Microsoft Office 365 then this is another feature that will come in especially handy for you and your teams.
From here you can monitor and trend all of your Office 365 applications and features.
You can generate reports on active users and mailboxes, as well as other house keeping relating tasks such as mailbox size and usage.
This is important because it helps you to keep a handle on your company’s spending, as well as how you can maximize your current budget.
When you make the comparisons between the Office 365 reporting and your standard Exchange installation on site you can start making much more accurate cost predictions about migrations to the Office 365 platform.
Comprehensive Microsoft Monitoring
If you have always wanted a single, centralized source of data for all of your Microsoft applications to be monitored from, then this is probably about as close as you can get with a third party tool.
SAM takes this style of monitoring one step further by allowing you to monitor all of your other systems from within this one application.
From here you can monitor multiple instances of Microsoft Windows, Microsoft Exchange, SQL Server and Office 365.
SAM offers you a complete Azure performance monitoring tool.
All of your monitoring, trending and correlation tasks are performed through one convenient app for Azure services and performance metrics.
The ability to monitor system and applications bot in the cloud and on site is impressive, giving you true hybrid capabilities.
Microsoft monitoring just got a whole lot easier.
Customization and Monitoring
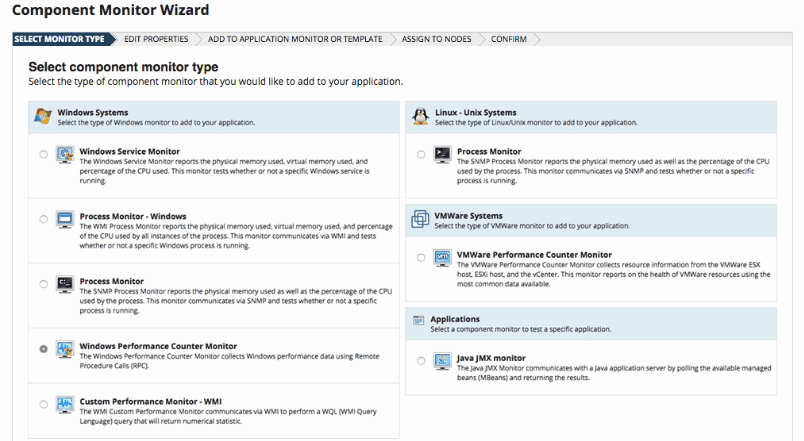
Having the ability to customize your monitoring components is a really big deal.
Most monitoring solutions that ship as all in one solution are either very rigid, and don’t allow for much customization.
On the other end of the spectrum, some monitoring solutions are open and very welcoming of development and changes through their API, but implementation can be tricky for non-developers.
SAM allows you to create custom monitors and even to modify the built-in templates that come with the application.
It is this level of customization that gives SAM its level of versatility and usefulness.
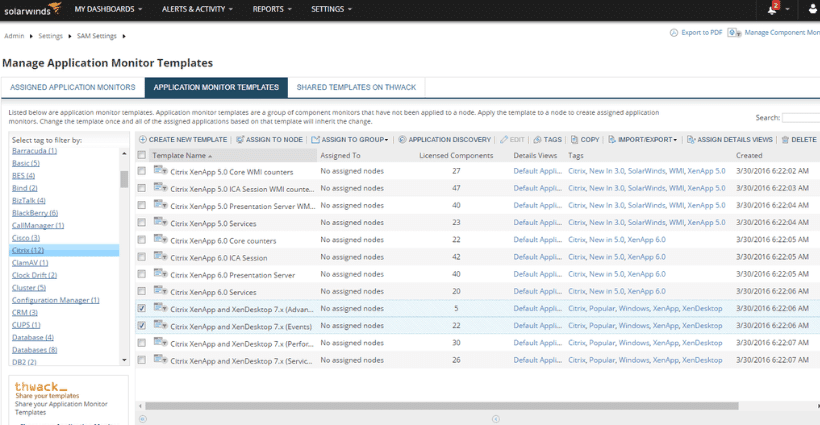
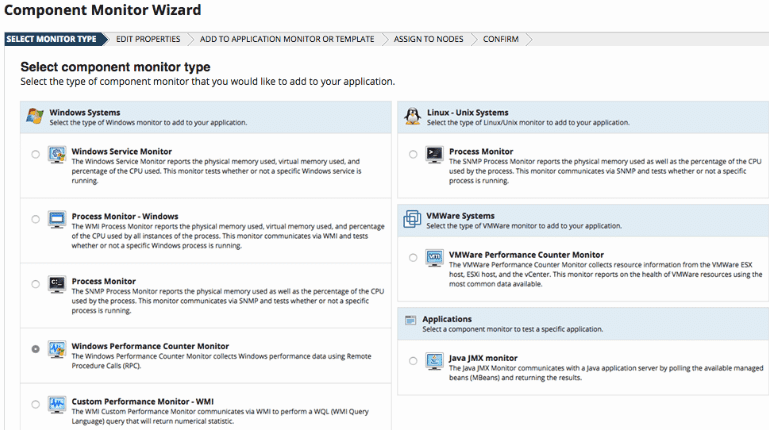
Built-in Template Functionality and Benefits
We’ve heard a lot about the templates that ship with SAM, but not an awful lot about what they can actually do for your systems and servers from a monitoring perspective.
The systems and applications templates are actually designed as performance and troubleshooting tools.
This is very useful because not only are there over 1200 of the templates that are supported, but they also cover a vast array of different subsystems, making it far easier to monitor and troubleshoot them.
Below is a list of systems, applications and functions that these templates can help you with, particularly in implementing best practices.
Active Directory
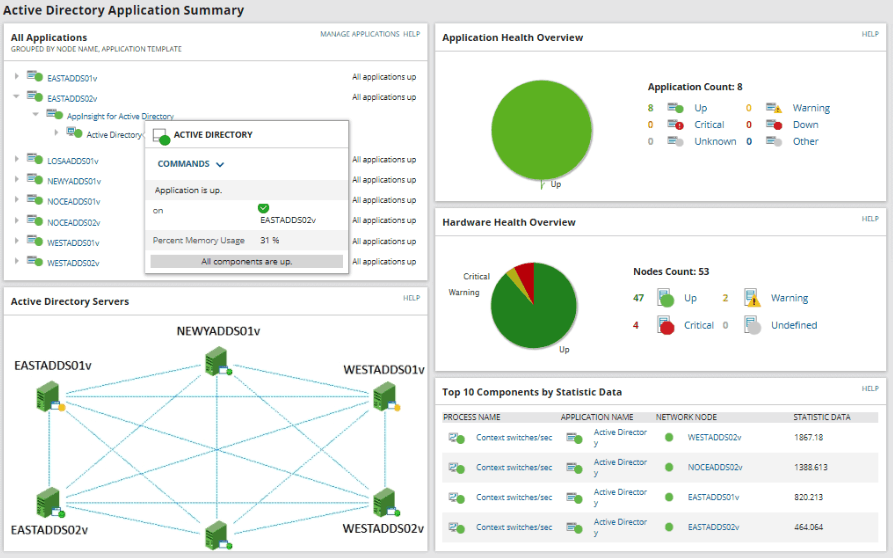
There is a laundry list of benefits that SAM can provide you with in an Active Directory environment, but the main ones are:
- It can help you to diagnose Active Directory replication issues by quickly allowing you to view the replication status between domain controllers, which ensures the overall health of your Active Directory as a whole.
- It allows you to review the roles of each domain controller from a single point. This is especially handy for seeing all of the domain controllers as well as their FSMO roles that they have each been assigned.
- It gives you the ability to view Active Directory site details, which will give you valuable information about your current Active Directory. It will allow you to gain insights into the site details of your remote installations, which is very useful for multi-site installations.
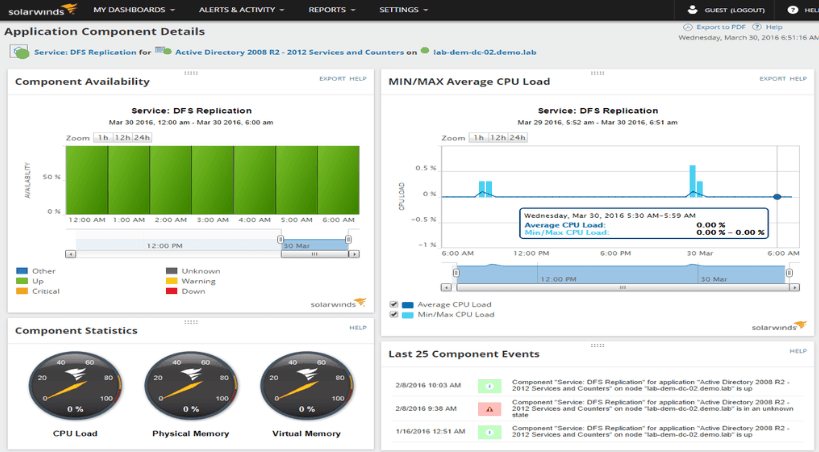
Replication Issue Troubleshooting
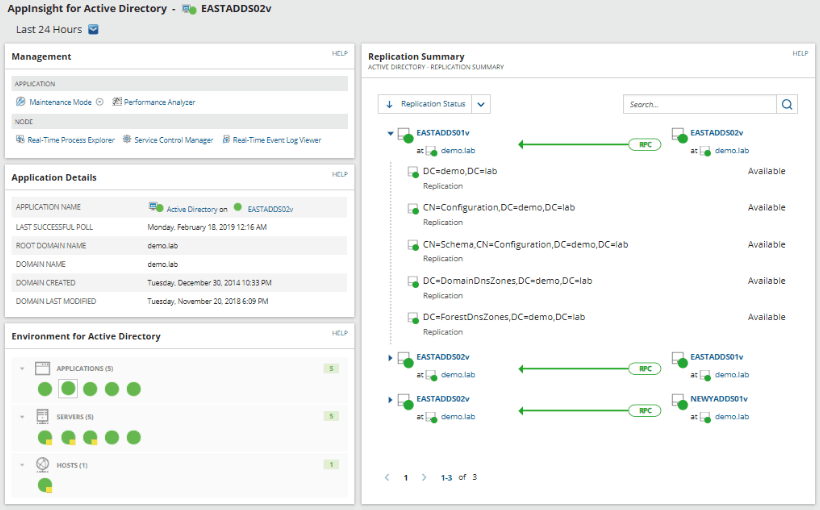
Replications are a big part of an Active Directory setup when using multiple sites, so ensuring that the process runs smoothly is very important.
You can easily view the current status of your replications by looking at the Replication Summary View inside of SAM.
You can also easily see the current overall replication status of your environment which will help you to see the bigger picture of how everything has either succeeded or failed while performing the replications.
You can get further information from each domain controller by looking at their schemas, ForestDNSZones, and other information that relates to the successful and smooth operation of your Active Directory.
Review Domain Controller Roles
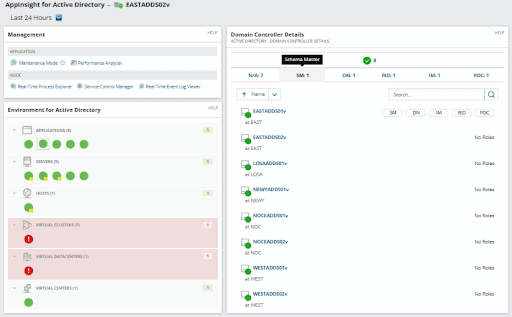
By viewing your Domain Controller Details in Solarwinds SAM you are able to quickly and easily find out exactly what the status and role of each Domain Controller is from a single location.
It allows you to view, sort and search for the different FSMO roles within the environment, meaning that you can find out important information when you need it.
Things such as FSMO role sorting by Schema Master, Domain Name, Infrastructure Manager, Relative Indentifier Master and Primary Domain Controller Emulator are all easy to check and review from SAM.
View Active Directory site Details
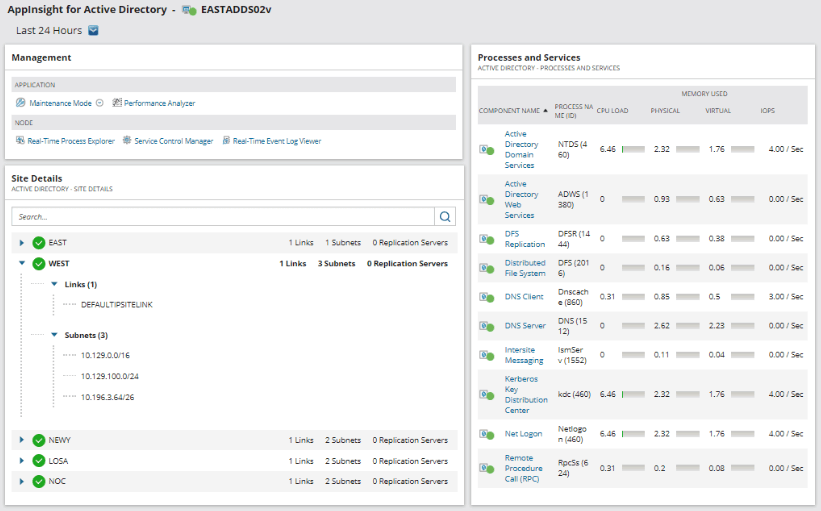
By looking at the AppInsight for Active Directory pane within the SAM application you can get a lot of important information at a glance by simply looking at the Site Details window.
In this section you can quickly and easily see Site Details which outline resource allocations and much more.
You can drill down even further by looking at the site link names as well as the subnets of each IP range, which will help you to quickly understand and troubleshoot issues for your Active Directory setup from a single remote location.
Monitor Logon and Windows Events
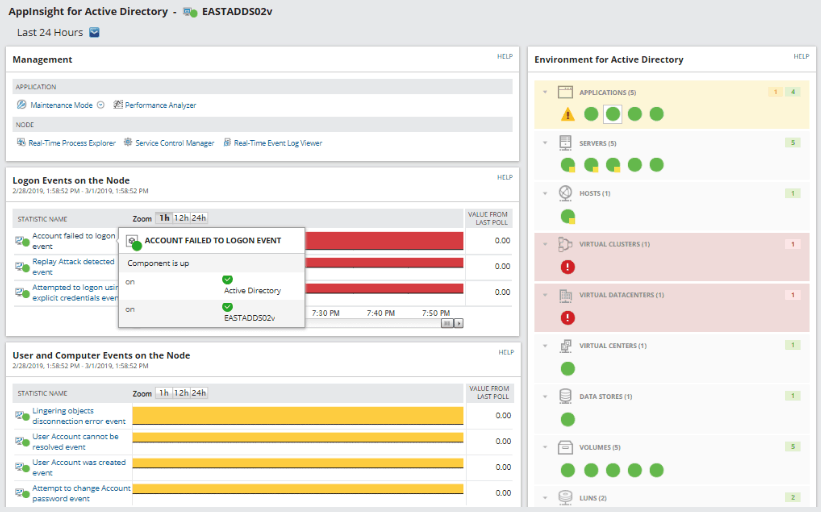
Being able to get an instant view of what has been happening on your servers with a Windows Events log is a really big deal for system administrators.
SAM has a built in Active Directory auditing tool, which makes your auditing tasks that much easier.
Basic stats to keep an eye out for are failed logon events, user creation and deletion, password reset attempts, and much more.
You can get even more information by correlating the event IDs of each instance with the logon and Windows Event details, making it much easier to compile reports for management.
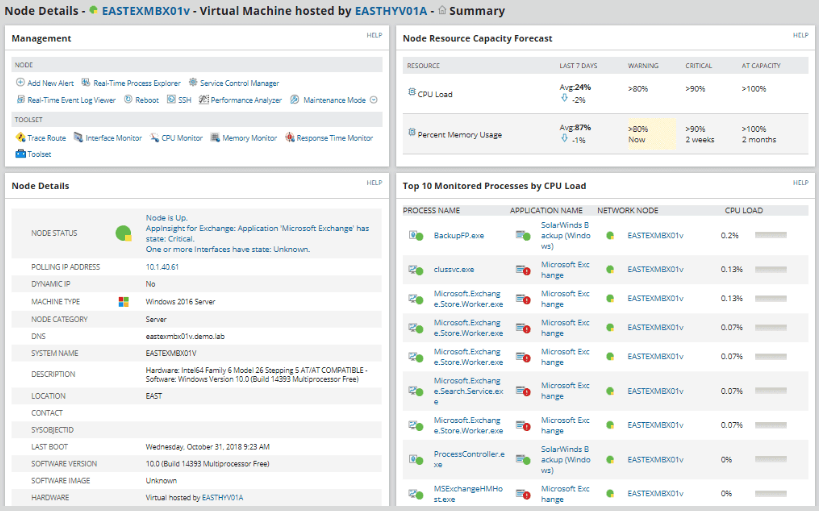
Windows Server Management and Monitoring
SAM is very good at ensuring that your Windows Server installations and applications are always running efficiently and that they are online at all times.
You will be able to check if they are running optimally.
From SAM you are able to:
- Check if the resource utilization is correct, allowing for optimal performance. You can also forecast your capacity requirements based on previous activity, allowing you to trend out your future requirements. You can also monitor the resource consumption as well as predict the time that you are most likely to run out of resources, based on your usage and growth with your servers.
- Create alerts and notifications, and customize them to be at their most useful. This helps you to set up a baseline so that the threshold breaches that occur will trigger a notification or warning so that you can catch errors before they become a major issue.
- Manage your assets and keep an eye on your current hardware inventory. This is an auditing tool that can help you to save many hours of manually capturing serial numbers and asset numbers. It also helps you to keep a record of software licenses and installation instances, making it a valuable record keeping tool.
Resource Utilization Optimization and Forecasting
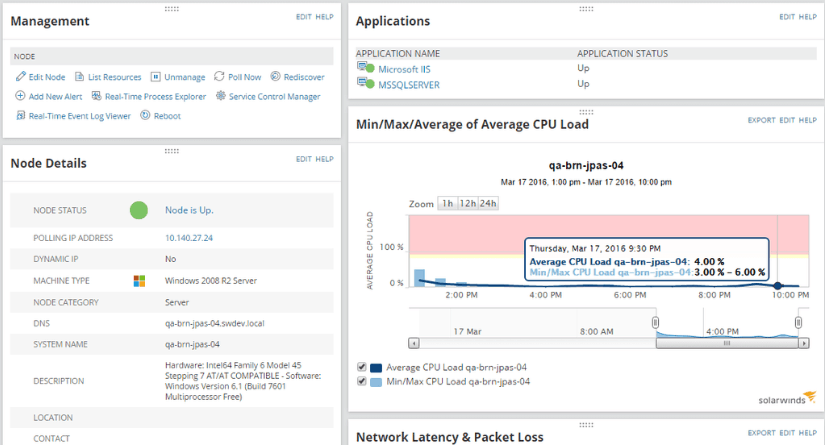
The SAM application is able to assist with capacity planning by delivering charts and metrics from its built in capacity planning functionality.
It helps you to quickly and easily find out when an issue is becoming a bigger problem, and will bring these items to your attention before they can cause system outages or other critical issues.
By using this feature you can:
- Easily view high CPU usage, memory shortages for both physical and virtual memory instances, as well as the available disk capacity and storage volumes
- Find trends and peak average capacity for specific time periods. This will help you to find the timeline of specific issues, and can be a big help when predicting allocation shortages, or in performing post mortems and finding root causes to system failures
- View historical consumption for your servers, giving you an idea of what normal usage looks like compared to your current state
Custom Alerts and Better Troubleshooting
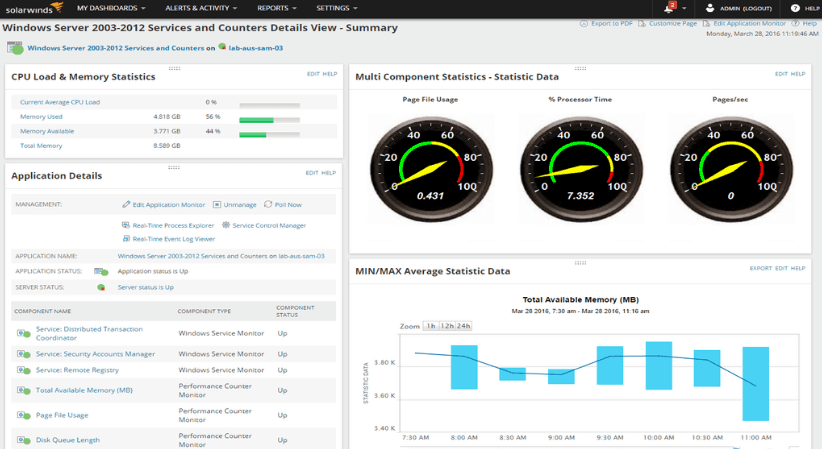
SAM comes with a lot of built in functionality right out of the box, and one of these is the built-in Windows monitoring template features.
These templates allow you to collect server performance metrics like CPU utilization, memory consumption, page file usage, hard disk information such as activity, space available, and queue lengths.
You can also view the network load of each of your servers, giving you information about network load balancing, if it is implemented.
Other items that can be easily viewed are the print service, remote desktop service, FTP service, Windows Update Service, and more.
You can get alerts when ever the performance levels exceed your thresholds, or drop below certain levels.
You can use these features as a real-time monitoring solution that will give you all of the troubleshooting tools that you need to combat rogue processes.
You can kill these processes from SAM’s user interface, restart and stop services, view event logs, and even perform server reboots.
Manage Asset Inventory and Detect Hardware Failures
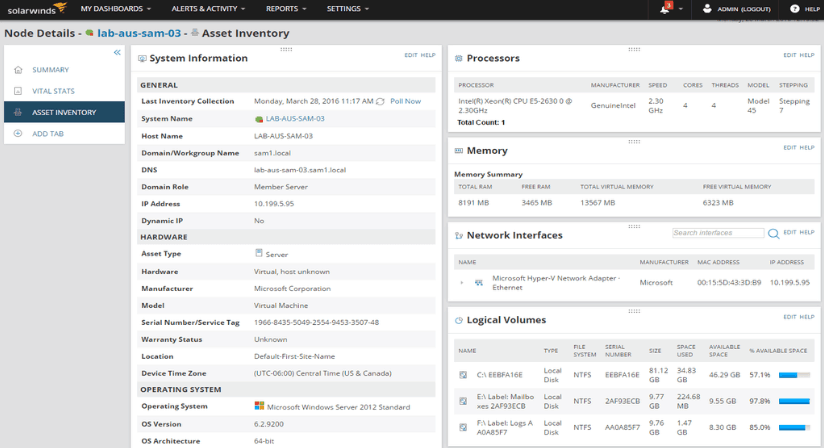
SAM has built in server monitoring tools so that your inventory scanning is made much easier.
This built in IT asset inventory functionality will allow you to scan and discover items within your Windows environment, and it allows you to collect hardware and software information such as drivers, firmware versions, hard disk drive types and capacities, virtual machines, hard disk logical volumes, RAM, network interface cards, CPUs, software that is installed, Windows Update information, OS patches and updates, and more.
Server monitoring is also made easier as you can also view things like temperatures, battery levels, CPU temperatures, fan operation and power supply states.
You can arrange to get alerts and warnings if any of these components threaten to fail.
Monitoring of Windows and Applications

SolarWinds SAM also offers built-in capacity forecast charts that give you access to all of the essential metrics that you need in order to reliably predict which servers will reach critical thresholds ahead of time.
This greatly reduces down time and helps call planners to coordinate the appropriate resources and teams where they are needed before any problems arise. Microsoft applications are well covered with this capability such as Windows Server, Active Directory, IIS, Exchange Server, Dynamics CRM, Skype for Business, SQL Server, SharePoint, DHCP, DNS and a whole lot more.
On the third party end of the spectrum there is more than enough support for products such as Oracle, Java, Linux, Unix, VMWare, AIX and Solaris. Tomcat, Apache, and Citrix are also supported.
This essentially gives you a wide spread of monitoring capabilities that will allow you to keep tabs on everything that is happening in your environment.
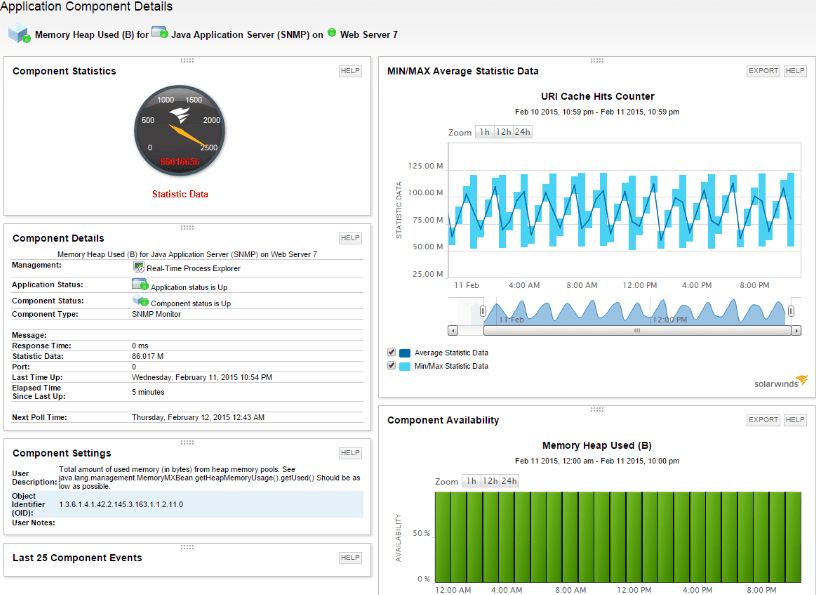
Java Application and JVM Monitoring
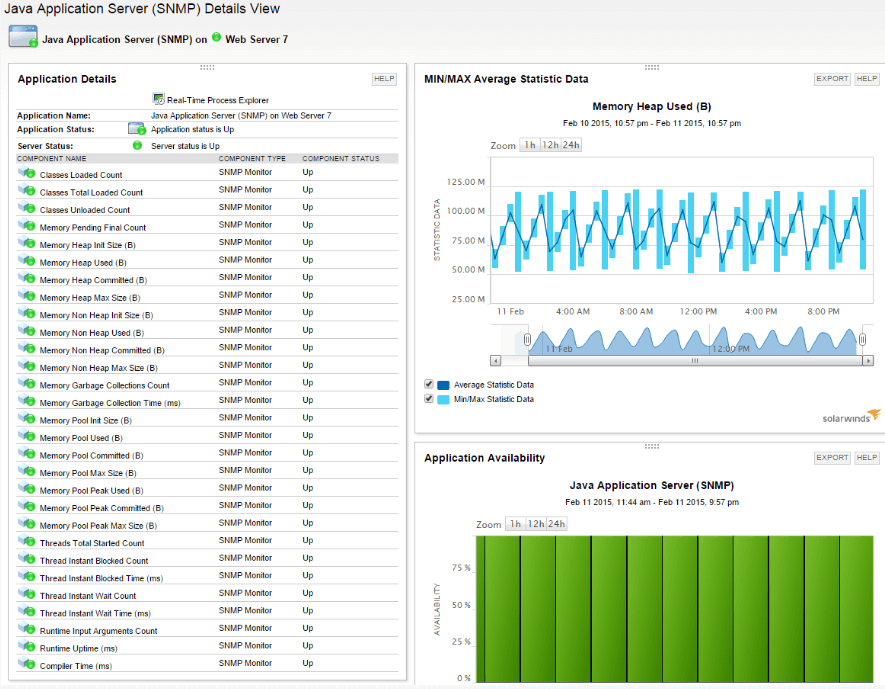
Just when you thought that there couldn’t possibly be any more specialized monitoring services available through SAM is when you’ll discover that it has amazing Java support for both applications and JVMs.
It allows you to monitor multi-vendor Java application servers all through the same interface.
This means that your key performance indicators and metrics for server applications such as JBoss, GlassFish, IBM WebSphere, Oracle WebLogic and Tomcat Server are all catered for under one umbrella.
You can identify Web service APIs that have a direct or indirect impact on Java applications, meaning that the process of troubleshooting is that much easier as your dependency chains are much better defined.
You can track JSON availability in real time, as well as performance.
Another key area that is very useful is that you can also quickly and easily detect database issues that might be causing poor application performance.
This is especially handy in a corporate or enterprise environment where custom applications exist.
The underpinning technologies that power such applications can be monitored by SAM, giving you an added layer of visibility to your troubleshooting procedures.
You can measure metrics such as resource constraints, inefficient queries, high IOPS latency, and much more.
Multi-vendor Java Application Support
You can use SolarWinds SAM to monitor Java through its specialized monitoring tools.
It is useful for monitoring services such as JBoss, WebLogic, WebSphere, Oracle, Tomcat which is done by using SNMP and JMX protocols.
This makes it possible to receive alerts before any major issues surface.
Issues that are easily monitored include:
- Databases, classes loaded and unloaded, and the total load count
- Memory related issues such as memory heap size, heap used and non-heap used, garbage collections, collection time of garbage collections, the pool size, the pool used, and pool peak
- Concurrent threads and threads started count, the blocked count, the blocked time, wait count, wait time, and more
- Application runtimes, uptime of runtimes, compiler time, and more specialized metrics that relate to Java
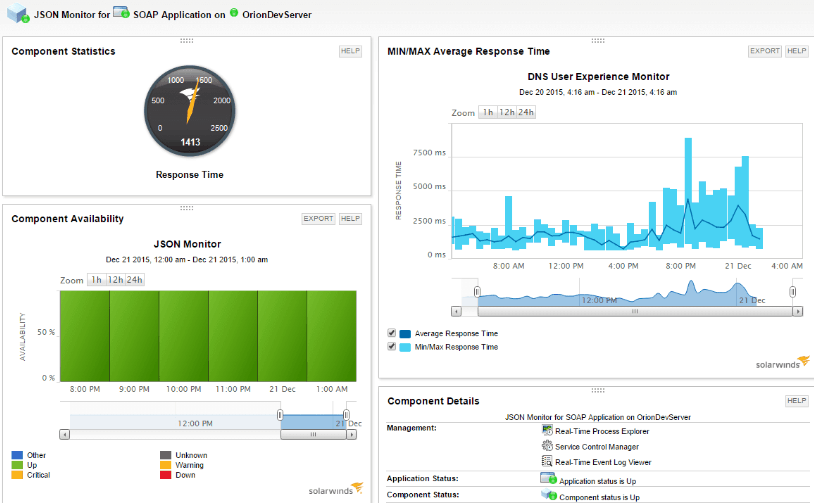
Find and Identify Web Service APIs Relating to Java Applications
If you need to monitor web services like JSON and SOAP, then you are in luck. SolarWinds SAM has a lot more Java application functionality, and it allows you to monitor the JSON and SOAP availability in your current setup, to see if it is up or down.
It also gives you information such as latency and can help you to validate the content that is returned to it.
There is default support for HTTP/HTTPS component monitors and you will be able to actively monitor the overall health of JSON services that are running across the entire range of your servers.
You will easily be able to track and monitor DET, PUT, POST and DELETE methods by using this functionality via the user experience monitor.
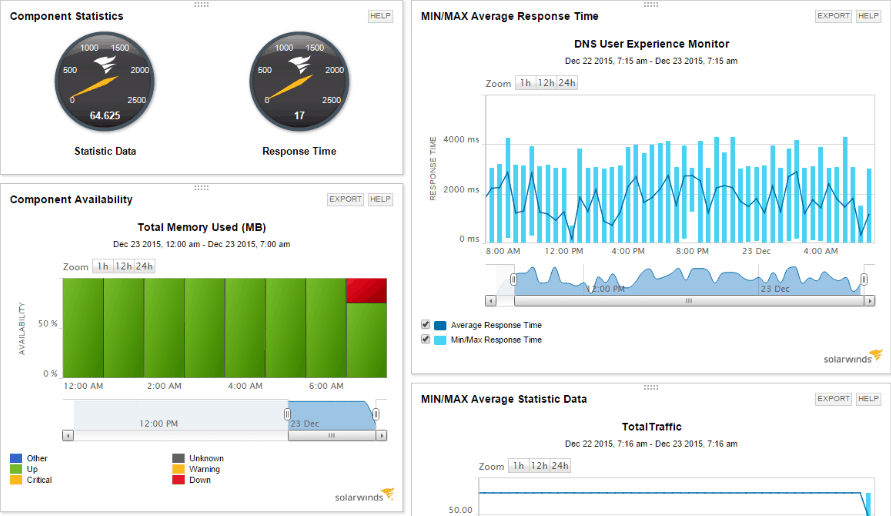
Detect Database Issues
Anyone that has worked with databases will know how critical their performance is for the continued health and overall functionality of dependant applications.
SAMS helps with monitoring such services and finding issues such as IOPS latency, fragmentation issues, slow queries, memory shortfalls that might impact your Java applications, and a lot more.
You can also use the Java performance tools that com with SolarWinds SAMs to monitor and troubleshoot metrics such as ODBC database connections to popular vendor solutions such as SQL Server, MySQL, Oracle, MongoDB, PostgreSQL, IBM DB2, OpenEdge and more.

Java Application problem are sometimes a result of infrastructural issues that are no related to the software at all. It is for this reason that the SAM application is especially useful for finding particular faults within your operational environment.
There are also operating system issues to contend with that can also hamper your application’s performance. Luckily these are all factors that can be monitored through SAM.
There is also built in Postgres SQL Monitoring for continued reliability. (More on that below)
Continuous PostgreSQL Monitoring
With the PostgreSQL monitor you can proactively view and action issues as they come about, which will let you find out what is going wrong with your database if it is running slow, is looking bloated and oversized, has too many active connections, or triggers that you need to query.
It allows for intelligent alerting and will help you to eliminate false positives by setting up dynamic alerts which you can base on statistical baseline metrics.

Because you can actively monitor the PostgreSQL database so efficiently it makes sense to use SolarWinds SAM for anything from active database connections to database table sizes.
The total number of indexes, locks and triggers is also viewable, along with the biggest number of index scans, sequential scans and row reads.
The database cache hit ratio, as well as successful transaction rates are also available for monitoring.
The SAM application also gives you powerful alerting options for components within your PostgreSQL environment.
If any failures or performance issues occur then you can receive real time alerts so that you can start mitigating any issues as soon as possible.
You will receive alerts for slow database performance issues, CPU and memory usage, response time, packet loss, network latency and any other metric that could help you to determine why there are performance issues on your database.
Because the threshold based alerting system relies on statistical data to calculate your baselines you can get relative alerts that apply to your specific instance of the PostgreSQL that you have configured and set up to run.
Citrix XenApp and XenDesktop Monitoring
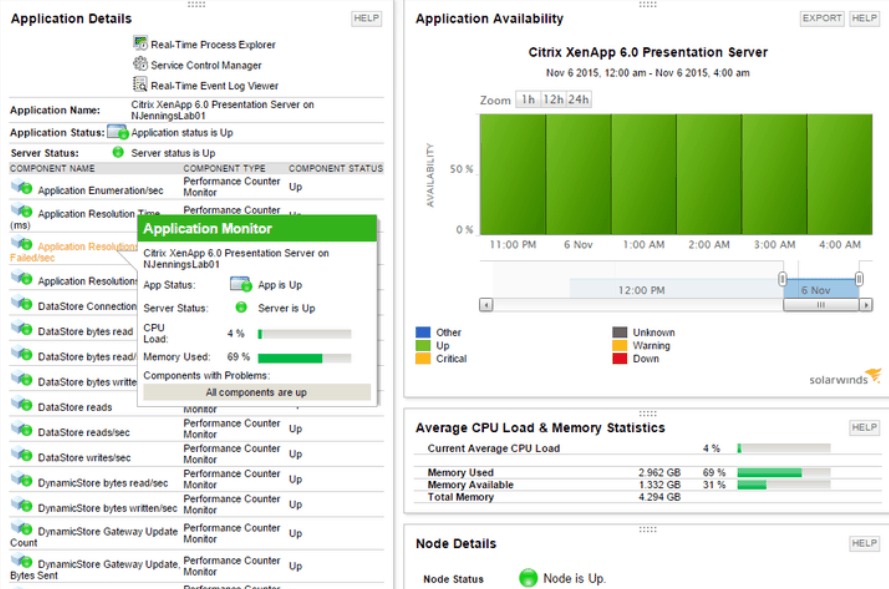
SolarWinds SAM allows you to proactively monitor your Citrix farm, making sure that everything keeps running optimally and smoothly.
You can monitor XenApp and XenDesktop CPU usage, load and utilization as well as other important performance counters.
Quickly and easily view and monitor system processes, services and events all from a single screen.
You will receive immediate alerts which helps with the time that it takes to troubleshoot issues.
It will help you to find issues faster and start remedial action before an outage even occurs.
You can use this to help you to correlate and analyse issues after the fact, and is useful for finding the cause of system issues.
Citrix monitoring tools are a part of the SolarWinds SAM application, and they include preinstalled templates that give you Citrix monitoring capabilities.
You can monitor Citrix XenApp performance counters via the WNI, ICA session and presentation server and services metrics, which are all present in the same dashboard.
Other crucial monitoring metrics include:
- CPU entitlement/reservation/shares/usage
- IMA network traffic sent/received, and active connections
- Secure Ticket Authority (STA) metrics
- ICA session bandwidth metrics (input/output/latency)
- Datastore read/writes and connection failures
- DynamicStore read/write
- Encryption ActiveSync service
- End-user experience
SolarWinds SAM gives you the ability to fully utilize Citrix performance monitoring alerts when a particular part of the system starts to fail.
It will alert you about slow sessions, intermittent session drops, inconsistent logins, as well as unavailable applications or desktops.
The information that is gathered is statistical and based on the thresholds that you set up within the application, so you can decide how serious certain drops in metrics are for the entire operation, and you can act accordingly.
By setting the thresholds you can also weed out any false positives, and only be alerted when it is absolutely necessary.
There are some instances where your Citrix applications are running correctly on the server end, but you still receive complaints from end-users.
This could happen for a few reasons, but the main causes are usually connectivity related performance issues.
Because of Citrix’s dependence on a host operating system, it is important that you also monitor the health of the server that is running the Citrix applications.
You need to be able to view details about the problems that you find within the Windows or Linux operating systems.
You can monitor web server response and processing times, as well as failures on the domain controller and active directory end of things, all from the same console.
Create Custom Monitors
Customization is another great feature that SolarWinds SAM caters for, so you can create the monitoring solution that makes sense for your particular environment.
You can specify certain servers and applications in your monitoring solution, and you can exclude the non-critical servers, services and applications that you don’t need.
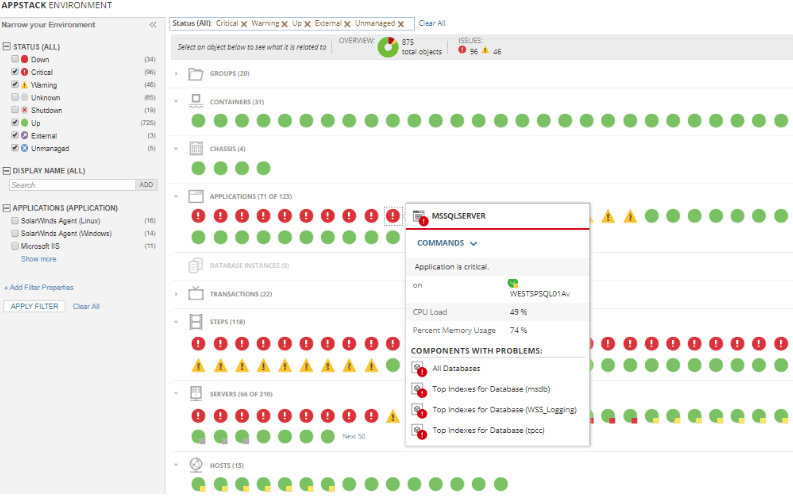
The AppStack dashboard is another tool that will help you to get the best out of your network.
It actively monitors and reports any issues on the application dependencies that you have specified in your setup.
This means that if a server that is responsible for multiple applications on your network should fail or starts developing a fault, then you will be alerted to the issues quickly.
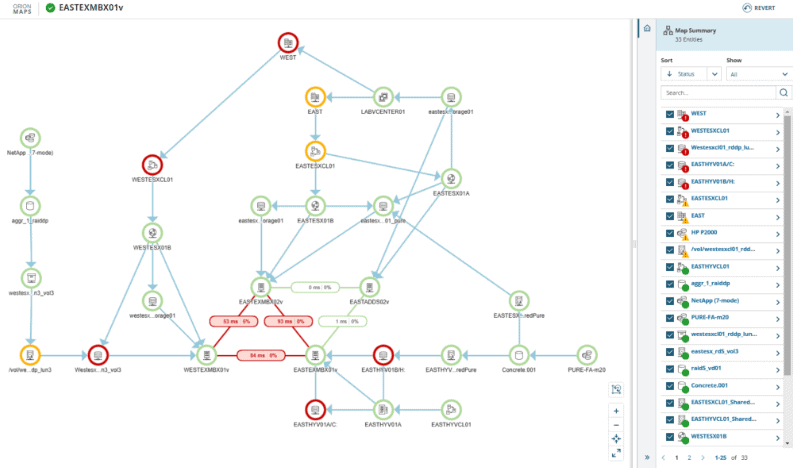
Most Networked environments are very complicated, so being able to automatically discover network based relationships can save you a lot of legwork while trying to figure out how everything connects to one another.
With SolarWinds SAM you can automatically discover the current devices on your network, and examine the inbound and outbound connections so that you get a clear idea of what is happening with the traffic flow.
You can examine and monitor metrics such as latency and packet loss, which helps you to get a good idea of what is happening straight away.
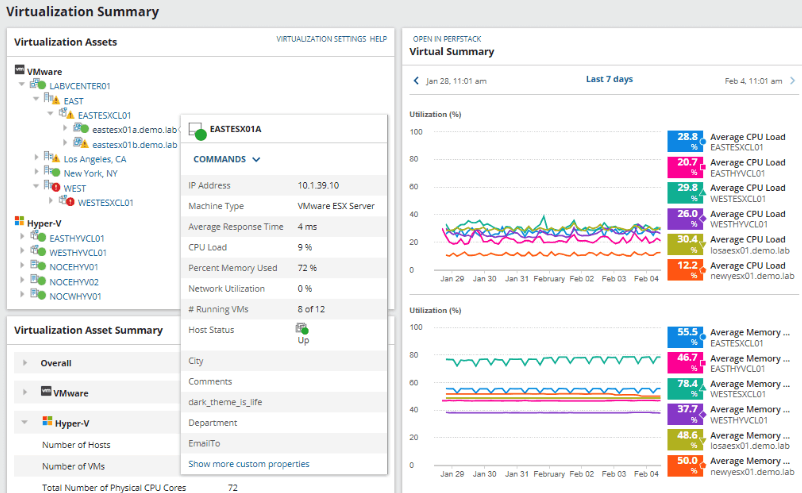
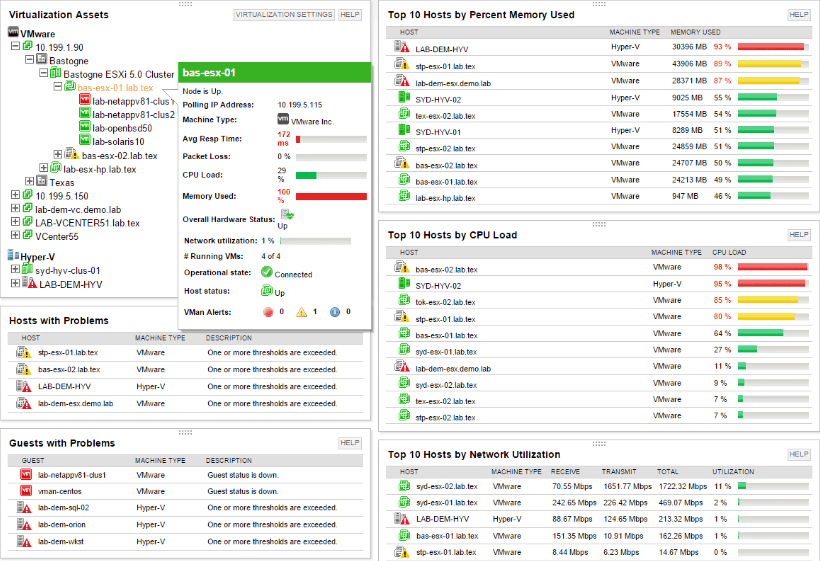
Microsoft Hyper-V and VMware ESX
Virtualization is a big part of the modern enterprise.
Many virtual machines are running all the time to ensure that the applications and services that the organization needs to run effectively are running.
Keeping an eye on your virtual infrastructure is critical, which is why having a suitable monitoring solution is essential.
Most virtual systems come with their own monitoring solutions from which the provisioning, configuration and overall setup is done.
Having an application that specifically monitors these systems is important if you are going to make sure that everything is running correctly within your business.
From SolarWinds SAM you can check the availability of your virtual machines, and troubleshoot as well.
Resource consumption and user activity is all viewable from within the application.
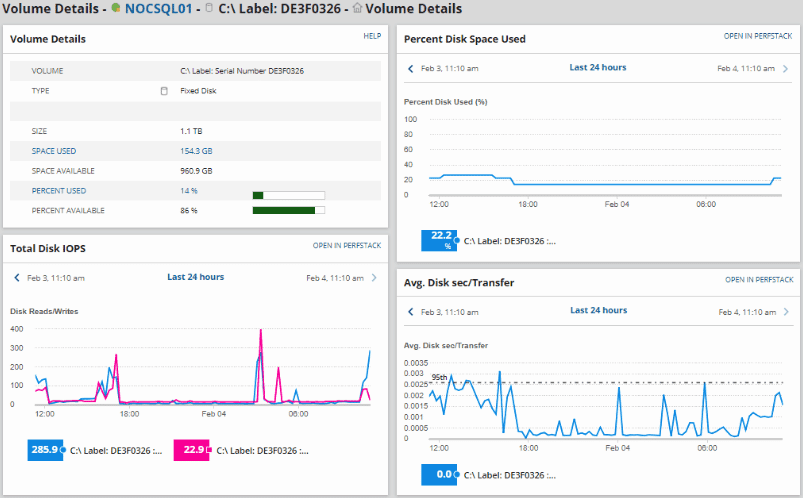
Server Volume Monitoring and Capacity Planning
Knowing how many resources your organization has when dealing with users is important.
You have to know how many users you are currently serving, and how many resources there are to go around.
If you are short in one area, then you need to start load balancing in order to correct the issue.
From SolarWinds SAM you can monitor your server storage volumes, how your disk usage looks, capacirty metrics, and much more.
Most of this functionality comes with the product, meaning that you don’t need to buy add on monitoring suites for specific product types.
You can get fine grain detail for issues relating to your SAN and NAS environments too.
Pricing
Pricing on this product will vary according to the number of targets you plan on monitoring.
Pricing starts at $2,995 but you can contact SolarWinds directly for custom a quote.
Conclusion
Proactive server monitoring is one of the best ways to save your organization money.
By minimizing downtime and system outages you are able to keep your operations running uninterrupted.
SolarWinds SAM is an ideal platform to achieve this from, as it covers so many different products and systems with its monitoring capabilities.
Finding out about capacity shortages and resource allocations is essential for anyone that is managing multiple systems across various sites, and because SolarWinds SAM allows you to set thresholds it is easy to quickly spot deviations from the norm.
Local monitoring is one thing, but with the hybridized nature of IT systems it is now a requirement for many monitoring applications to have both local and cloud based capabilities.
For provisioned services like AWS and Azure you pay for what you are using, so if you have inefficient or idle systems then you are spending money unnecessarily.
SolarWinds SAM helps you to quickly get a snapshot of what you are using online and will help you to cut out any unneeded resources.
Resources
There is a lot of data to take in when considering how much SolarWinds SAM can do, so we have put together a list of resources for you to take a look at to answer any questions you might have.
For technical requirements right through to financial questions, you should find just what you are looking for in the list below.
- Datasheet – This tells you all of the technical information that you need to find out if this product is suitable for your environment or not. All of the technical specifications are within the datasheet link.
- Interactive Demo – Click on the interactive demo link for a test run to see how the program operates.
- Overview Video – Check out this YouTube video showing the overall features of this application.
- New and Exciting Features – This is a break down of all the new and exciting features that have come to SAM since the last release.
- Supported Applications – This link gives you a complete run down of exactly what is supported with SolarWinds SAM
- System Requirements – This is the minimum system requirements that you need to be able to run the SolarWinds SAM application
- Free Trial Download – A free trial version is available for you to download from this link
- Installation Guide – This installation guide will give you an idea of how easy it is to install the application. It covers all the basics and should let you know if you are up to the task of installing the application or not.
- Getting Started – This is a quick start guide that will show you how to get up and running
- Evaluation Guide – This is the link to download the evaluation guide
- ROI Benefits – This shows you how long the product could take to pay for itself, also known as a Return on Investment Schedule
- Free SAM eLearning – Check out this link to found out what free lessons and courses are available through SolarWinds.
- SolarWinds Events, Webcasts and Training – This link keeps you informed of all the latest happenings within the company
- SAM Product Community Forum – Talk technical with other SolarWinds users and customers
- SAM Product Blog – This blog outlines all the latest happenings within the SAM application