SolarWinds is a software company based in Austin Texas where their global headquarters can be found.
They have 2,500 active employees around the globe, with 275,000 customers which span some 190 countries.

SolarWinds is active primarily in the network and systems management spaces, making them an excellent choice for anyone that is looking to improve their monitoring and visibility capabilities within an organization.
The company was started in 1999 and has been developing different products since then.
In this article, lets take a look at one of their main products, SolarWinds Network Performance Monitor.
SolarWinds Performance Monitor Review
SolarWinds Network Performance Monitor is an advanced network monitoring solution that will help you reduce network outages while increasing its overall performance.
This is made possible thanks to the underlying technologies that make up SolarWinds Network Performance Monitor.
There is support for Cisco ACI devices as well as the ability to view ACI health statuses for these devices.
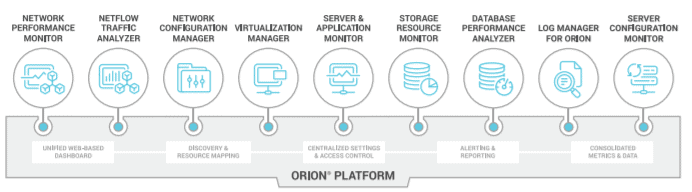
You can also use the installer to upgrade your existing Orion Platform products.
Some Benefits of Using SolarWinds Network Performance Monitor Include:
- Speeds up the troubleshooting process
- Helps to resolve network outages
- Reduce downtime
- Customizable network topology
- Dependency aware intelligent alerts
- Capable of generating wireless heat maps
- Automated cap
The simple design gives you a streamlined dashboard that is easy to use, and the new security gives you a safe connection between your Orion server and SQL instances.
Now we’ll deep dive into some of the main features that you can expect to find within SolarWinds SolarWinds Network Performance Monitor.
Key Features:
- Multi-vendor network monitoring – Get alerts from the equipment that you have in your organization, even if you have a mixed environment with many different manufacturing types.
- Network Insights for deeper visibility – Find out about what is going on in your networking environment by checking trends, alerts and patterns within your systems, equipment and appliances.
- Intelligent maps – Build intuitive Intelligence Maps for greater insights into the current structure and performance of your network.
- NetPath and PerfStack for easy troubleshooting – Quickly and easily find out what is causing network and connectivity issues from this same application
- Smarter scalability for large environments – Go as big or as small as you need to, scalability means that you can adapt with the times and change your organizations monitoring capabilities whenever you need to by upsizing or by downsizing
- Advanced alerting – Create custom alerts that make sense to you and your environment, giving you enough time to act when problems arise
- Unexpected simplicity – This product has been designed to be easy to use, with intuitive menus and simple navigation.
- Fully scalable – The application is ready to go right out of the box, regardless of your organization’s size.
- What you need, when you need it – Configure the monitoring software to match your requirements with fully customizable options.
- Built by IT pros, with IT pros – This product has been built in consultation with networking engineers and IT professionals, so you know that it is built to cater to your needs
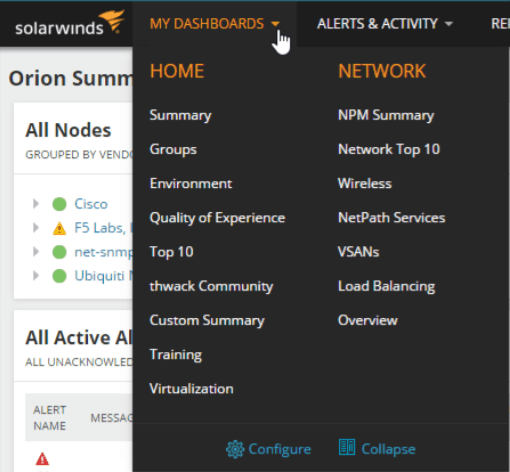
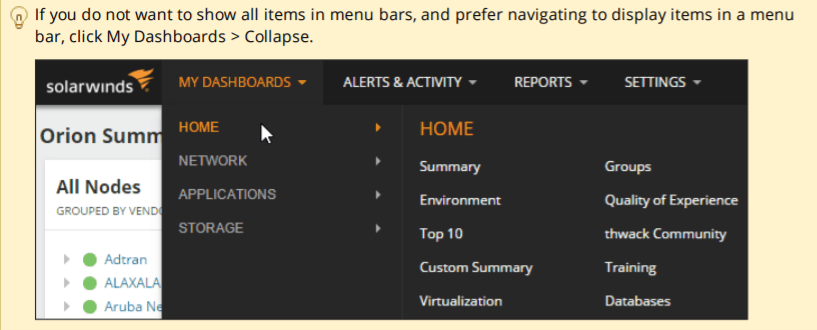
The menus work very well and it has all of the dashboard options all in one space.
Items such as Home, Summary, Groups, Environment, Quality of Experience, Top 10, thwack Community, Custom Summary, Training and Virtualization.
On the Network end of things there is a SolarWinds Network Performance Monitor Summary menu, Network Top 10, Wireless, NetPath Services, VSANs, Load Balancing and Overviews.
Everything is grouped logically and it is easy to find exactly what you are looking for.
Comprehensive fault monitoring and performance management for your network:
Learn how to reduce network outages with all of the new features found in Network Performance Manager.
Find out how you can quickly reduce network issues by detecting problems before they become much larger network issues.
The software is very easy to use and is intuitive for users that want to learn how to quickly start monitoring their network.
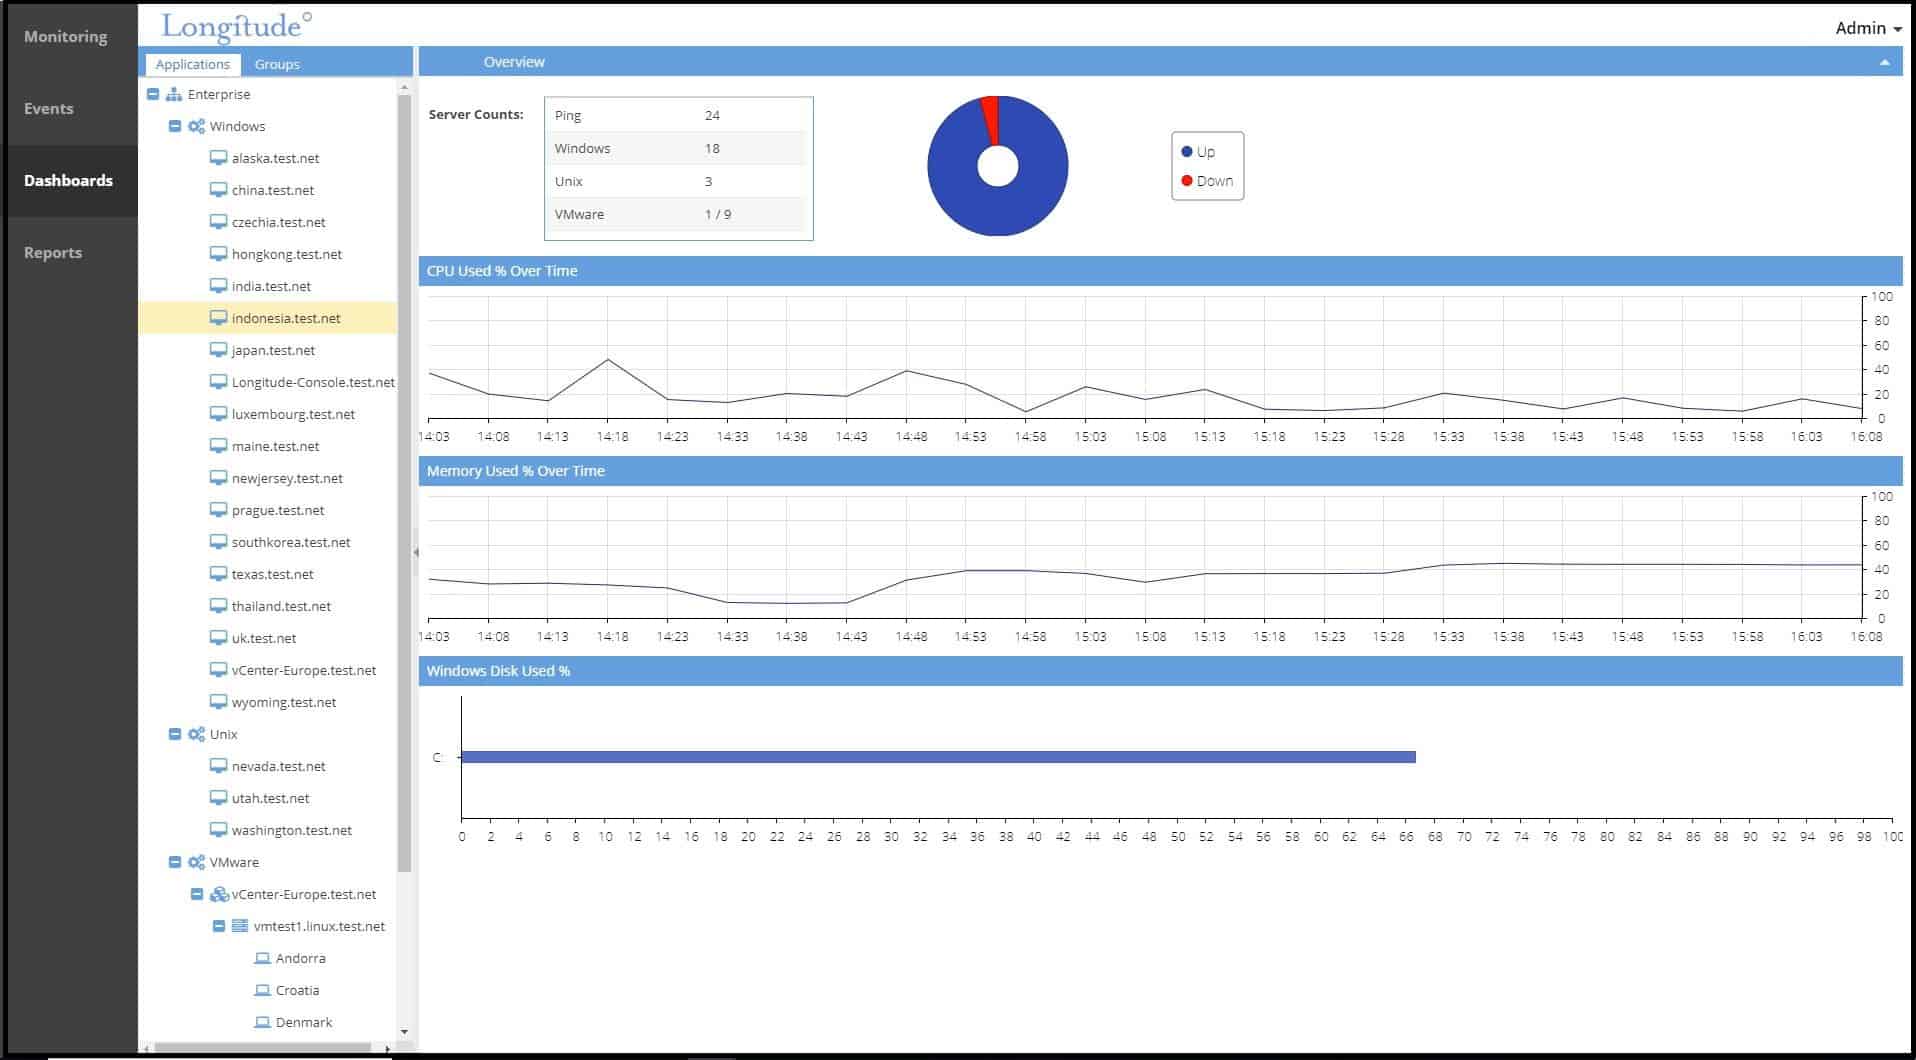
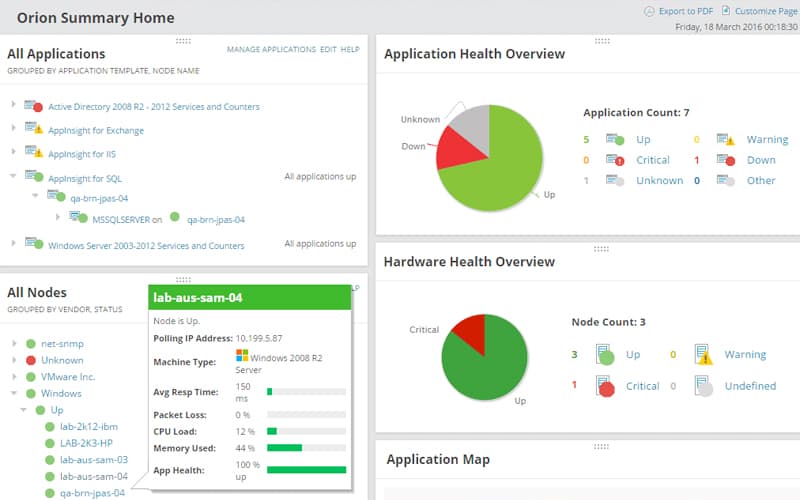
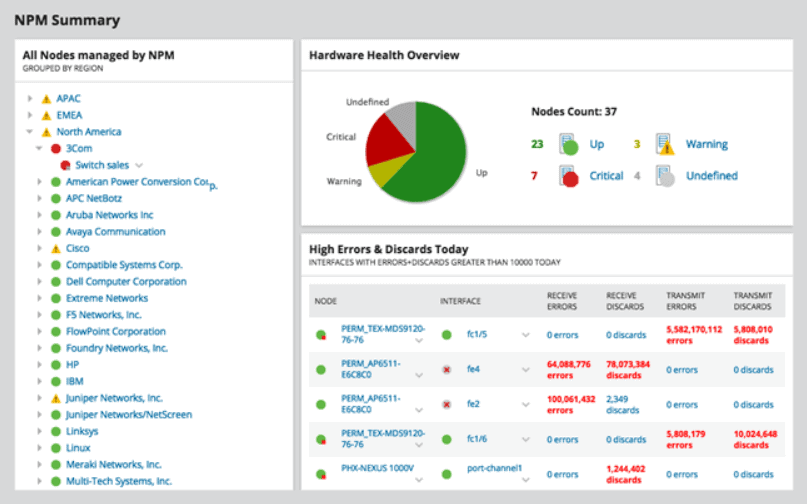
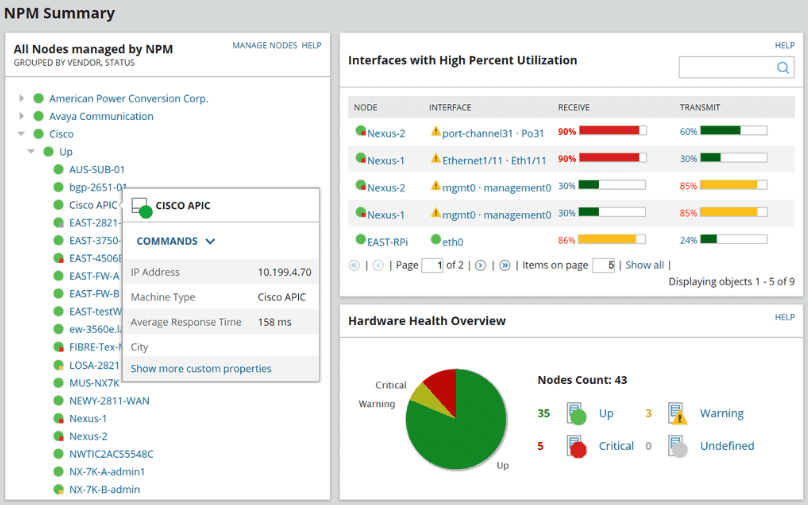
The SolarWinds Network Performance Monitor summary page shows all of the most common networking items that you would expect to find such as the number of devices that are up, as well as the devices that are in a warning or critical state.
You can quickly and easily find out which nodes are being monitored by SolarWinds Network Performance Monitor, as well as the overall Hardware Health of the items on your network.
If you need to see which devices on your network had the most errors and issues on a specific day then you can see all of this information as well.
SolarWinds Network Performance Monitor has added some much needed features to its already comprehensive feature set such as:
- Cisco ACI support – Allows you to monitor your Software Defined Network environment with support for Cisco ACI, giving you deeper insights into your current environment’s performance and its state of operation
- Centralized upgrades – The ability to upgrade components remotely and over the network is important, and SolarWinds Network Performance Monitor allows you to do this with no problems.
- Set up SSO with SAML authentication support – Having 2 factor authentication and Single Sign On technology is important, especially when you need to give team members access from outside the network. This kind of access also opens vulnerabilities from outside of your own network, so being able to authenticate users properly is vital to your organization’s continued security.
- Performance analysis upgrades – PerfStack™ is a vital tool for cutting through the extra SSO you can remove noise generated from raw data to help quickly surface anomalies.
- Check the health status of your Orion deployment – Orion Diagnostics on the web: collect diagnostics from your polling engines directly from the Orion Web Console and access your deployment health directly from Settings.
Get to the root cause quicker with intelligent, dependency and topology-aware network alerts:
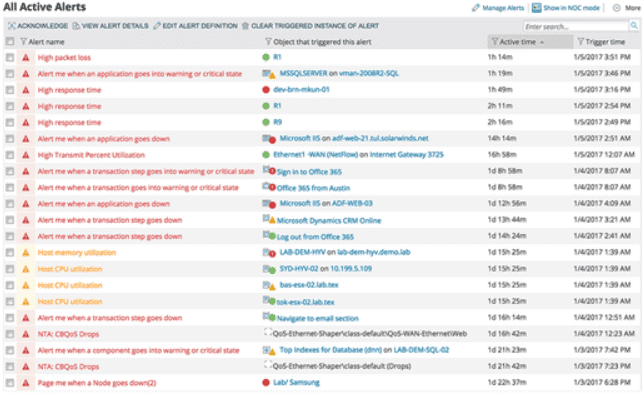
SolarWinds Network Performance Monitor is centralized, which means that all of the alerts that come up are quick and easy to go through, helping you to cut through the unnecessary flood of unnecessary alerts.
When unnecessary alerts clog up your viewing window then you will miss the important alerts and you might leave a serious issue unattended.
These kinds of false alerts cause huge problems for your network, and can lead to down time and revenue loss, which means that your IT team is in trouble.
If any monitoring solution is to be successful then it has to be customizable, and luckily SolarWinds Network performance Monitor lets you do just that.
You can set the thresholds, frequency of the alarms and much more when setting up your environment, helping you to find only the most important issues.
This helps you to get to the root cause of your network issues much faster, and will help you to see exactly what is causing the issue.
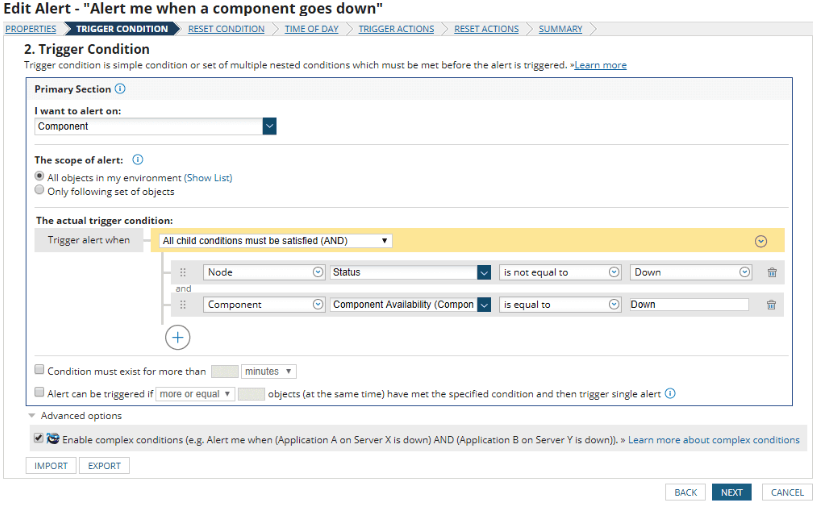
On top of all of these customizable settings you can also quickly and easily edit your alerts, which lets you create intelligent warnings about your network.
These network alerts are intelligent and are dependency driven.
This means that the topology of your network is take into account when the system is diagnosing issues and generating alerts, which will help to speed up the troubleshooting process.
The actual notification system is web based and allows you to quickly and easily create alerts that are based on simple or complex events.
These nested triggers then allow the system to fire off an alert based on the parent to child dependency relationship and network topology configuration.
The end result is that you will receive more relevant alerts more often.
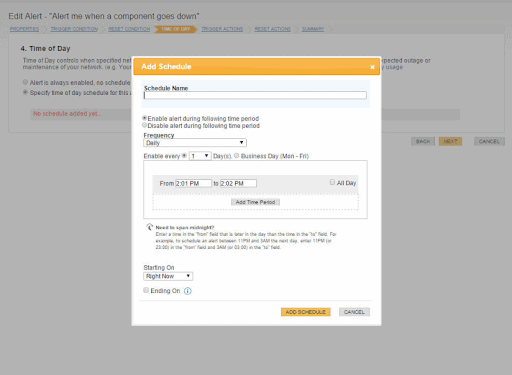
Schedule Your Alerts:
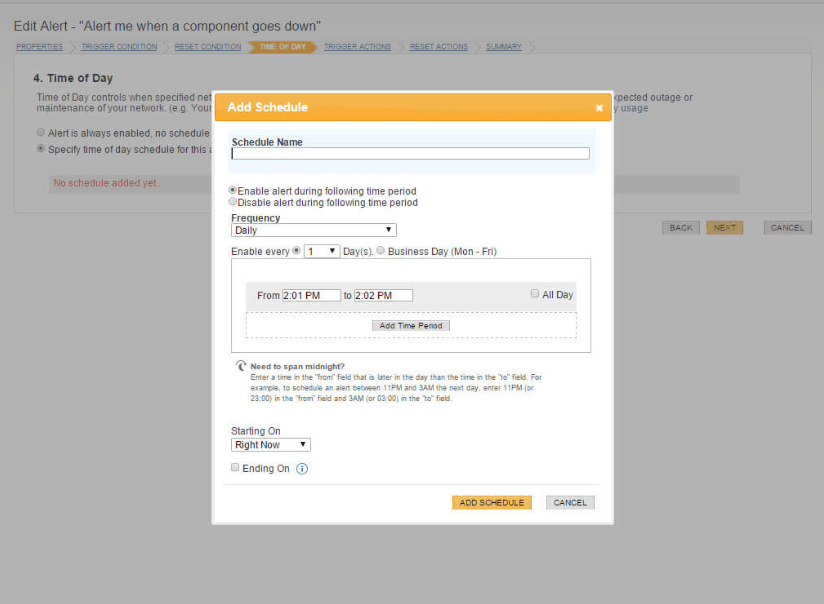
If you have times of the day when you do not need alerts to be coming through, then you can simply specify when specific alerts are allowed to come through.
This means that non-issues such as alerts for desktops or printers on your network will be held back until business hours.
You can keep your critical alerts coming through for things such as servers and core switches.
These alerts can be redirected to your support staff that are on standby for after-hours support.
This also means that if you have any maintenance or downtime that needs to be done during certain times, then you can disable the alerts during this time.
If you have a known issue that occurs at certain times or days of the week or month, then you can also silence those specific alerts so that they do not disturb your monitoring operations.
Stay Informed and Act Fast:
Getting network alerts is one thing, but if you are receiving an avalanche of useless information then you are actually no better off than receiving no alerts.
This is because it is impossible to discern between the critical alerts and the garbage alerts.
More than just a simple alerting tool, SolarWinds Network Performance Monitor also allows you to setup and configure custom sets of actions to take when a particular event occurs.
You can have an email alert sent for certain events, a text message sent for other alerts, or execute a script when particular alerts come through.
You can make your own rules about what you want to happen when things start to fail on your network.
You can be the first person to know about network issues with these intelligent alerts.
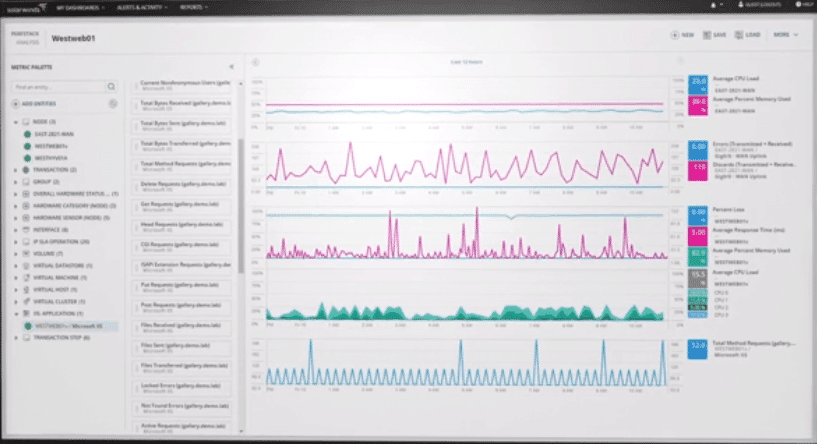
You have multi-vendor support, high performance and network availability monitoring all through the same Network Performance Monitor application.
Visual representations make it very easy to see exactly what is happening on your network at any time.
Graphical portrayals of the errors on your network give you a much better idea of what is happening on your network.
Monitor Network performance with Hop Based Analysis:
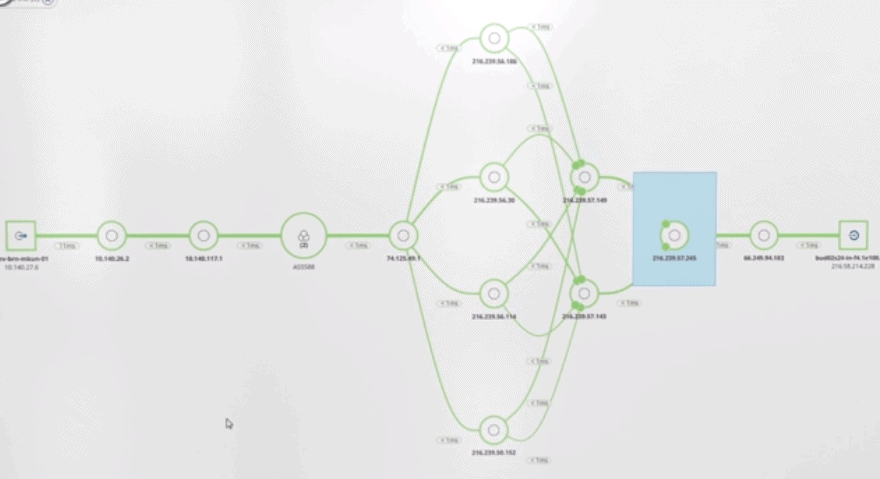
With SolarWinds Network Performance Monitor you can monitor both in house servers and network appliances and cloud-based systems as well.
Much like tracert, you can look at packet latency and the number of hops each packet needs to take on its journey over the network.
Network intelligence gives you greater insight into the current state of your infrastructure.
With all of the information available to you, you can quickly and easily find out what is causing the issue and reroute your traffic if necessary.
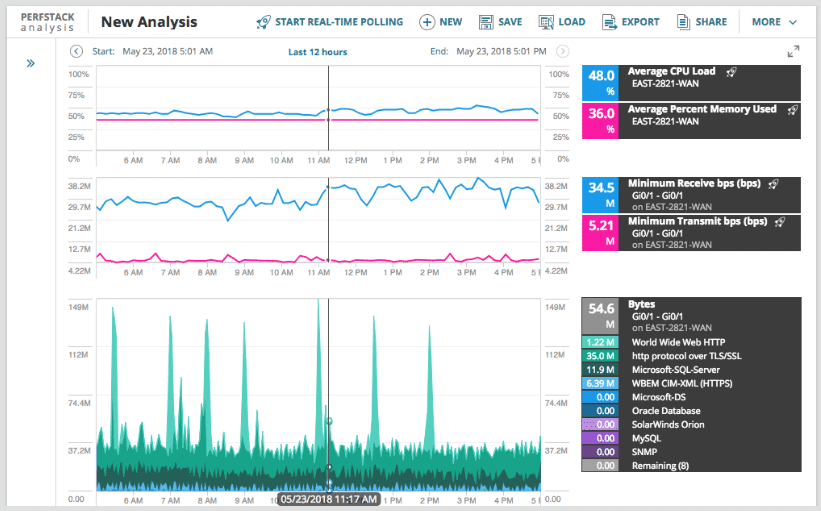
PerfStack Cross Stack Network Information Correlation:
Accelerate the discovery of issues on your network with PerfStack.
It allows you to quickly and easily accelerate the discovery and identification of root cause by drag and drop techniques.
You can monitor network devices such as servers and applications from this single console.
It allows you to acquire the current availability and performance metrics of your network, and lets you set up the automation processes that you need to remediate and reduce issues that cause downtime and performance problems.
It will let you gain the ability to get your monitoring solution online and monitoring in no time at all.
There is a simple setup wizard that will give you plenty of options.
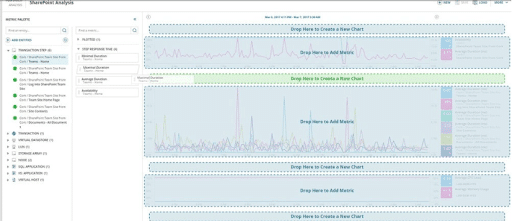
One of the great ways of learning about what is happening on your network is through PerfStack because it lets you gather information from all over the network in an easy to use interface.
There are different data types that let you compare information against all the other data sources on your network.
It also gives you a unified timeline that shows the progression of each data type against its own progression timeline.
This makes data easy to analyze and study, especially when you get it from multiple sources.
If an event occurs on your network that has effects on more than one data type, then you will also find that the PerfStack application can pick it up and correlate the events with one another.
Compare Disparate Data Types Side-by-Side:
Troubleshooting issues like performance and reliability on a network is very difficult without the right tools.
If you have data coming from a few different pieces of equipment, then the formats that they come in will be very different.
With SolarWinds Network Performance Monitor you can import all of these different data sources and formats and have them all in the same window for comparative Window for easy viewing.
The best way to properly analyze a difficult network problem is to draw information from multiple information sources, and the try to compare and collate the data.
PerfStack lets you do this and works hand in hand with SolarWinds Network Performance Monitor.
PerfStack is a different product and must be purchased separately but is made by SolarWinds and works very well with the majority of monitoring applications.
A Visual Guide Your Network’s Health:
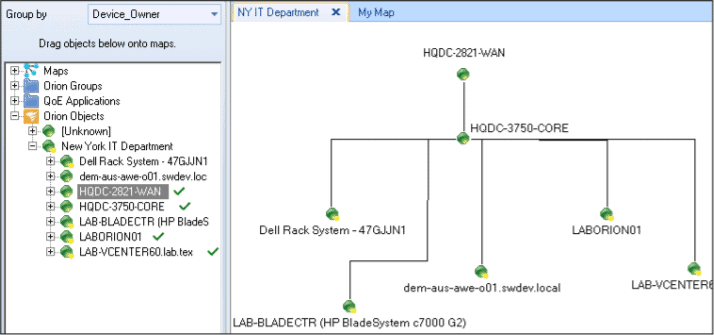
You can find your network appliances and important items within your environment and map them out easily.
You can drag and drop them into a diagram so that your layout is exactly as you want it to be.
This makes it very easy to organize your application so that your window is arranged exactly as you want it.
Having visibility of your network helps you to easily work out what section of your network needs to be repaired.
This make it very useful for fast troubleshooting which ultimately reduces downtime and saves your company money.
SolarWinds System Center Management Pack:
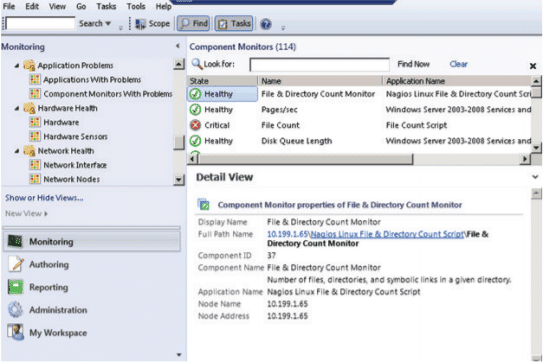
SolarWinds also has a System Center Management Pack that gives you added integration with this enterprise monitoring application.
In essence it provides additional monitoring for all of your servers, links and applications that have support from Microsoft System Center Operations Manager (SCOM).
Microsoft System Center Operations Manager (SCOM) is one of the most popular enterprise monitoring frameworks that is available on the market.
It is so popular because it can be extended by integrating alerts and information from 3rd party applications.
It also works very well with SolarWinds Network Performance Monitor via the Management Pack.
SolarWinds’ monitoring solutions are designed in such a way so that they complement Microsoft System Center Operations Manager (SCOM) and enhance its capabilities by providing additional visibility for elements that are not visibly displayed, or natively monitored by SCOM.
Network Performance Monitor also allows you to:
- Check, inspect and view your network device health and performance
- Keep tabs on all of your applications as well as the health and performance of all applications, including non-Microsoft apps from vendors such as Lotus®, Oracle®, and XenApp™
- Discover what the transaction latency is for all of your web applications through SolarWinds SCOM Management Pack. This then gives you a detailed network and application analysis. You can find out valuable information from alerts and event information that comes from multiple sources such as SolarWinds Network Performance Monitor, Server & Application Monitor, and Web Performance Monitor all in one convenient location.
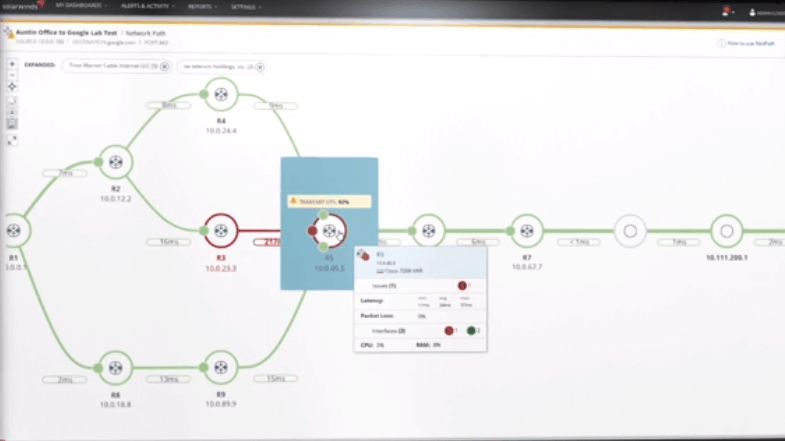
Visual representation of the health and performance of critical network gear:
SolarWinds Network performance Monitor lets you troubleshoot your network issues like an IT pro, even if you are not a Cisco guru or very familiar with how network monitoring works in general.
It simplifies the job of monitoring and makes it very easy to stay informed about the happenings in your environment.
It provides some very useful tools such as Network Insight for Cisco Networks, which is a service availability and health performance monitor.
This gives you critical data center switch status availability and is a big help in a data center environment.
It also gives you Network Insight for Cisco ASA, which allows you to automate the actual monitoring and management of firewall installations across you setup, and gives you a singular unified platform that you can easily monitor and watch.
Network Insight for F5 NIG-IP is another feature that is available in SolarWinds Network Performance Monitor, which allows you to monitor the health and performance of every component within the application delivery chain of your company’s infrastructure.
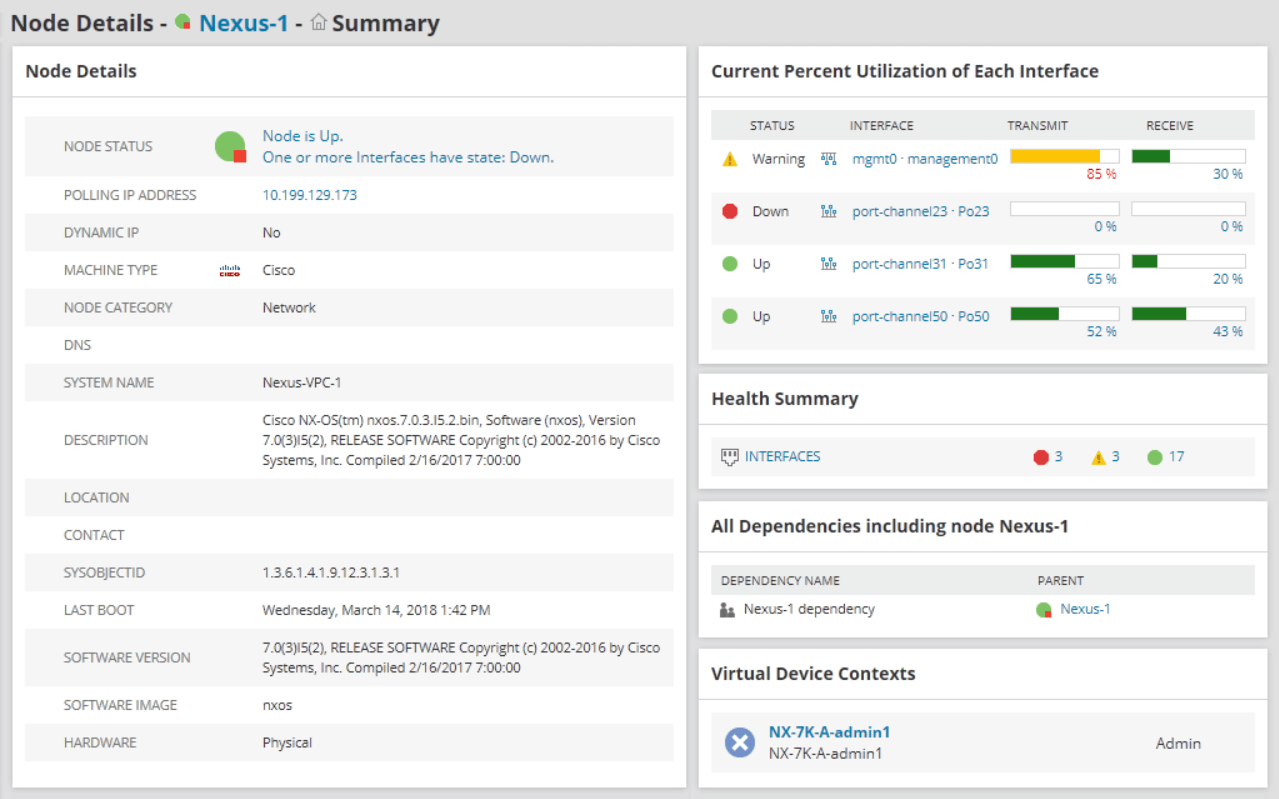
Network Insight for Cisco Nexus:
The main aim of using the Network insight for Cisco Nexus is to give you and your team a much deeper sense of what is going on in your network.
This added visibility means that you will be aware of issues before they become a problem, which is the best way to proactively manage any network.
This means that you can quickly spot issues and fix them while still maintaining all of the redundancy measures that you need to keep all of your applications and services running.
You can also gain valuable insight into the functionality of issues such as Port Channels and virtual device contexts.
This means that thousands of different interfaces across the different sites of your company inevitably become easier to manage.
This is primarily because there is the ability for you to view interface configurations alongside performance stats.
You can also get Access Control Lists into a much more manageable state thanks to the backup, history and search features.
This also makes it much easier to detect and optimize issues such as overlapping shadow rules.
Network Insight for Cisco ASA:
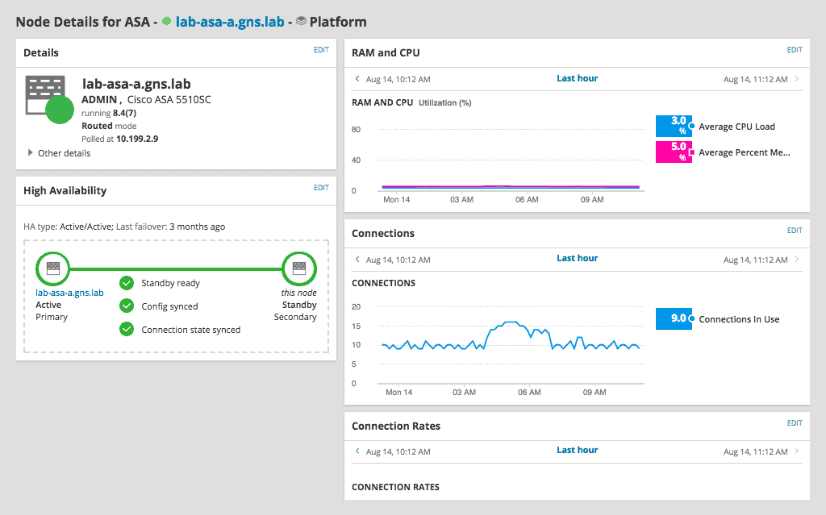
Firewall management doesn’t have to be difficult.
Network Insight for Cisco ASA gives you all of the tools to manage your equipment so that you can guarantee maximum performance and uptime.
You can quickly and easily view and monitor VPN tunnels and sessions, giving you the confidence to manage the performance of these devices.
You can use the ASA High Availability monitoring features to also optimize and Access Control Lists with shadow and redundant rule detection.
Network Insight for F5 BIG-IP:
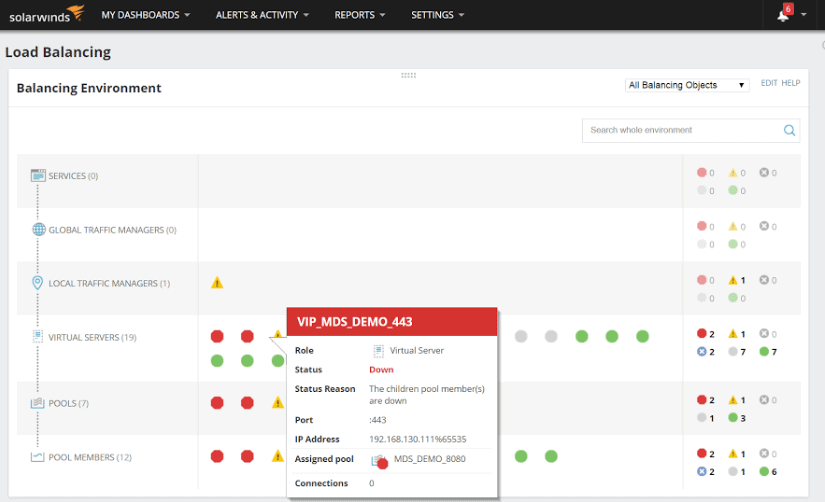
You need to monitor the overall health and performance of your entire environment.
This includes everything in your application delivery chain, which includes wide IP addresses, virtual servers, pool members and anything else that you want to monitor on your network.
More than just simply monitoring, you will also be able to view the relationships between these devices.
Each of these components has a detailed list of information including detailed statuses of each one.
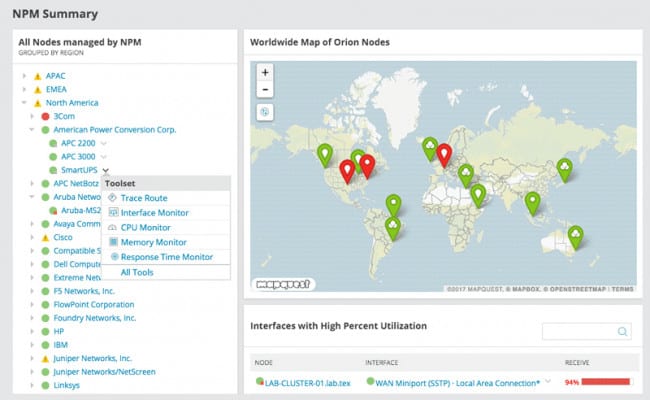
Get a better view with contextual and graphical portrayals of an entity and its physical and logical relationships with auto-updating maps:
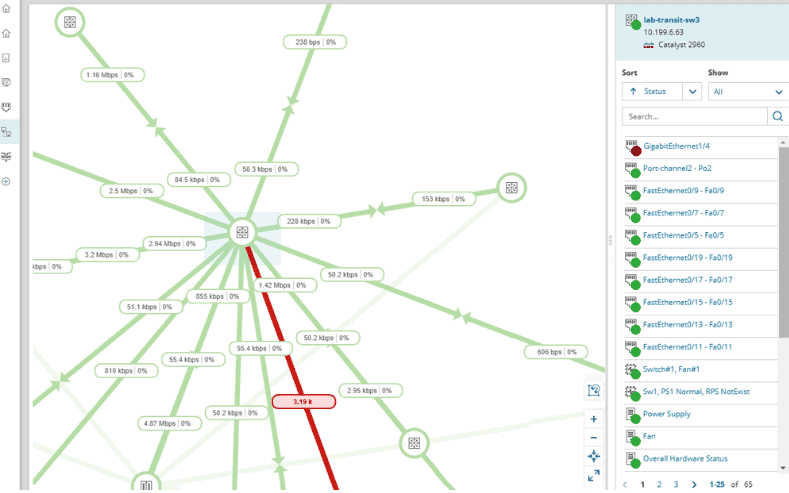
It is important for you to visually inspect the current layout of your network.
The different relationships between each device on your network needs to be monitored and watched, especially when the devices are critical to your network.
Auto updating maps are crucial to this visibility which is why the feature is so useful.
It allows you to look at routers, switches, specific interfaces, volumes, groups and other important elements on your network.
If anything drops off the network then it is automatically updated, which frees you up to go and fix the issue rather than get stuck with the administrative task of updating the map.
Measure the health of the logical network while still monitoring the physical network with Cisco ACI:
Modern networks are complicated.
Virtualization and Software Defined Networks have created a difficult environment to maintain.
SolarWinds Network Performance Monitor makes this much easier to monitor as it gives you the tools that you need to monitor APICs, tenants, application profiles, endpoint groups and physical devices.
All of these things are viewable when you are using the application and are available in a single location which is very convenient.
Measure on monitor your Wi-Fi , controllers, clients and access points:
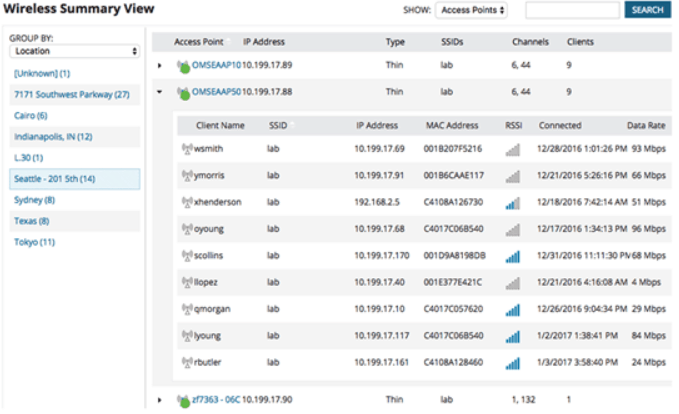
Using the wireless functionality of this application gives you much deeper insight into your network, including the wireless segment.
This helps you to gauge the overall signal distribution of your wireless output within the building, so you can also find dead spots.
If you know where your signal is failing to reach then you can either reposition your existing access points, or you can add more.
There are built in reports that can alert you to overall usage stats, and serious security considerations such as rogue access points.
This can help you to generate a baseline by which all your other comparisons can be measured against. You can also monitor Wi-Fi users and which SSID they are connecting to.
Calculate baseline thresholds:
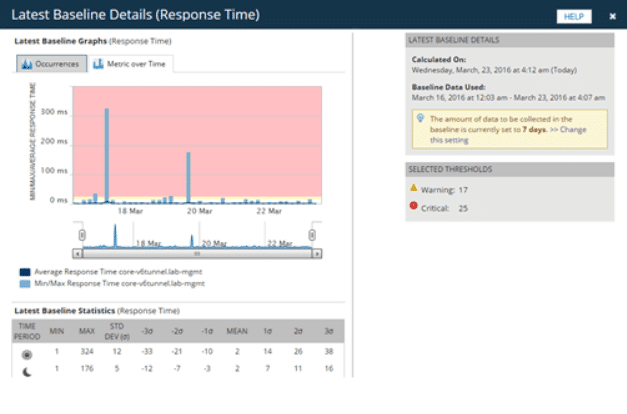
Being able to draw historical information from your alerts is important.
In order to dynamically configure your environmental and networking alerts you need to be able to establish your baseline readings.
SolarWinds Network Performance Monitor allows you to calculate what your baseline thresholds should be, and gives you a great starting point for your alerting setup.
This means that you can configure all of your alerts accurately because it calculates the dynamic baseline thresholds through data correlations.
Scale up to your monitoring:
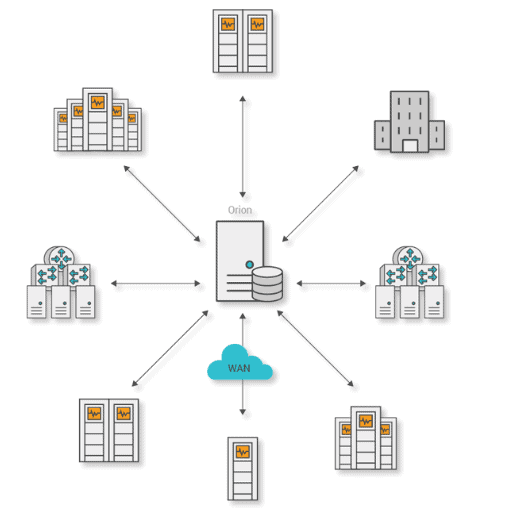
Most organizations and companies have multiple sites that need to be monitored.
SolarWinds Network Performance Monitor lets you stay in touch with all of your interconnected sites.
You can monitor specific ports on devices so that if any specific interface should go down then you will receive notifications.
You need to be able to monitor all of your devices from a single platform without relying on many different incompatible products.
Using SolarWinds Network Performance Monitor gives you all of the visibility that you need from the same application, meaning that your team only needs to learn the features and capabilities that relate to a single tool.
Free App for viewing, searching, and alert logging data from inside NPM:
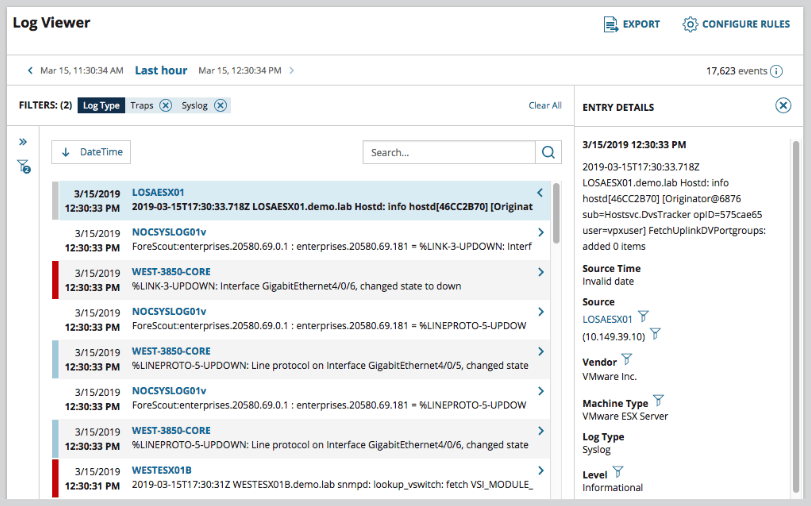
Using Orion Log Viewer is easy because it is built into SolarWinds Network Performance Monitor to collect, search, filter, and alert you and your team on syslogs as well as SNMP trap data.
All of this is obtainable from within the Orion console.
You can activate the usefulness of Orion Log Viewer for free with a trial of SolarWinds Log Analyzer.
The Orion Log Viewer tool will allow you to join the dots and find out which log data matches up with the performance and availability data of your systems.
This is all viewable on a consolidated timeline so you can analyse and troubleshoot issues that much quicker.
After your Log Analyzer trial expires, the Orion Log Viewer functionality stays functional inside of Network Performance Monitor.
Monitor your elements and poll them more often, or cover more sites:
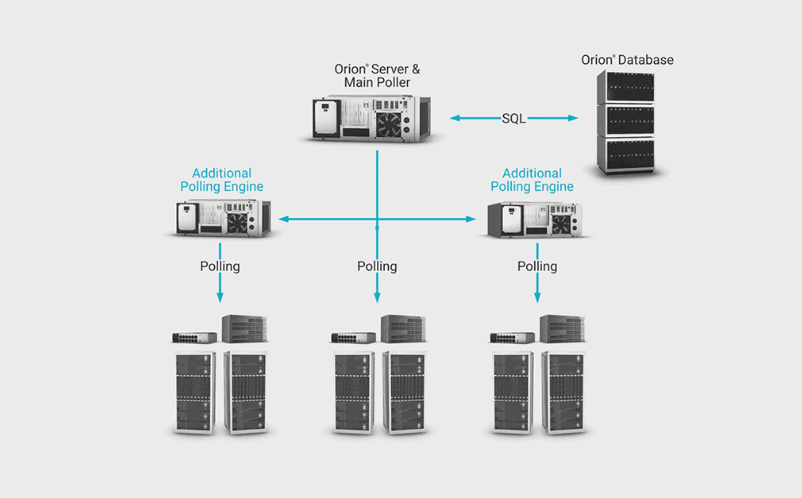
You have the ability to increase the rate of frequency of polling devices on your network. This means that if a device needs to alert you immediately should it fail then you can adjust the frequency so that you find out right away. This makes it very easy to continuously monitor remote locations and track your company’s uptime at the various sites. You also have the option of scaling to up your monitoring operations with up to 12,000 additional elements for each added polling engine that you choose to add to your existing setup.
Pricing
Pricing starts at $2,995
If you have custom requiremetns that cannot be catered for in the pricing table below, you can contact SolarWinds for a custom quote here.
SolarWinds Network Performance Monitor is licensed by the largest number of the three following element types:
- Interfaces: interfaces include switch ports, physical/virtual interfaces, VLANs
- Nodes: nodes include entire devices (routers, switches, servers, APs)
- Volumes: volumes are equal to the logical disks you monitor
Pricing for different licenses:
- SolarWinds Network Performance Monitor SL100 SolarWinds Network Performance Monitor SL100 (up to 100 elements)
- SolarWinds Network Performance Monitor SL250 SolarWinds Network Performance Monitor SL250 (up to 250 elements)
- SolarWinds Network Performance Monitor SL500 SolarWinds Network Performance Monitor SL500 (up to 500 elements)
- SolarWinds Network Performance Monitor SL2000 SolarWinds Network Performance Monitor SL2000 (up to 2000 elements)
- SolarWinds Network Performance Monitor SLX SolarWinds Network Performance Monitor SLX (unlimited elements-Standard Polling Throughput)
Conclusion:
SolarWinds Network Performance Monitor offers many different levels of functionality for your visibility requirements.
It gives you all of the functionality that you need to find out exactly what is going on with devices such as network switches, firewalls, VPNs and routers.
You can visually map out your network which makes it very easy to see what is happening in your environment at a glance.
If you want to take a look at how it works and what it can do for all of your monitoring requirements then you can download a 30 day free trial of SolarWinds Network Performance Monitor from here.
Download Free:
https://www.solarwinds.com/network-performance-monitor/
Resources:
https://www.solarwinds.com/resources/datasheet