Designed to monitor network devices in real-time, Paessler’s PRTG is one of the most comprehensive packages on the market. The name itself carries a lot of weight in the IT field, often considered to be the de facto standard among network professionals. Its modular sensor based system is simple yet powerful, making it the perfect solution for infrastructure of any size.
It’s rare to find a single platform that checks all the boxes, but this may just be the best exception to the rule. It’s a cost effective, scalable framework that supports nearly every networking technology in existence. Whether you need to monitor system performance, cloud containers or virtualization technologies, it has the tools for the job.
Over the course of this review, we will breakdown the main features offered by Paessler’s PRTG, look at the system requirements and cover the pricing model used for licensing.
PRTG Features
Network Monitoring
Network problems hurt business, it’s a fact. When something unexpected happens, it can cost you in more ways than one, and that is why proper Network Monitoring is so important. Catching issues before they can impact your users is priority numero uno.
In many cases however, System Administrators find they must combine a variety of different tools to achieve the full range of features needed.
PRTG on the other hand is an all inclusive package, capable of monitoring every aspect of your IT infrastructure right out of the box. Systems, devices, traffic and applications are all supported from the same interface.
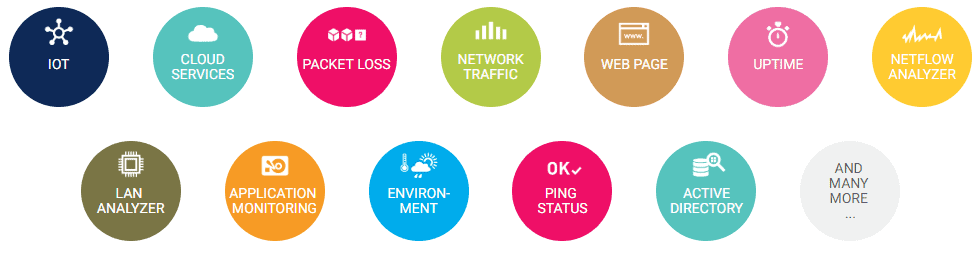
As they so eloquently put it, PRTG is designed to “monitor everything” and “show your whole network at a glance”. They aren’t exaggerating either, it works with LANs, WANs, servers, websites, appliances, URLs and more. Better yet, it integrates seamlessly with a number of vendors and applications such as…
- Oracle
- Amazon Web Services
- Cisco
- Citrix
- VMWare
- Microsoft Exchange
- Microsoft SQL Server
- SonicWall
If you are curious as to the technologies used behind the scenes, it pretty much supports them all. Compatible with SNMP (all versions), flow technologies (NetFlow, jFlow, sFlow) SSH, WMI, Ping and SQL.
In addition, they also have a versatile API that works with Python, VB, PowerShell, Batch Scripting and more, making additional integrations possible. Every single element that you can see in PRTG, from live graphs to historic data is exposed via methods in the public API.
Remote Probes
Having each separate device communicate with our centralized PRTG Core Server isn’t always the most efficient approach. When your infrastructure spans the globe, the added latency can directly impact performance and may slow down the monitoring itself.
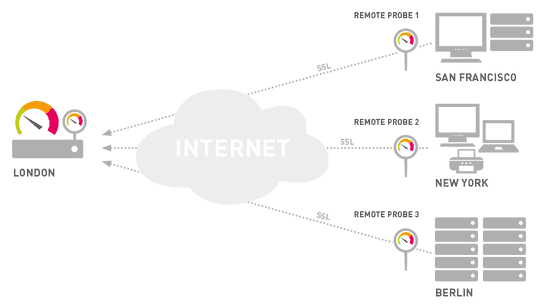
Using Remote Probes, we can delegate the workload to other nodes instead, allowing them to handle the legwork and then report back to the core system. In doing so, we distribute the monitoring load and effectively let an agent take care of a subset of the network.
Since Paessler includes unlimited Remote Probes with all PRTG licenses, we are not restricted when it comes to the structure. Hardware requirements are considerably less than the Core Server as well, where Probes can run on basically any machine with decent modern hardware. It’s not even necessary to use a dedicated node, it could be installed on one of the monitored devices!
Clustered Failover Solution
The PRTG Core Server is responsible for monitoring the rest of your network, but what happens when it goes down or becomes unavailable? For mission critical systems, we can’t run the risk of missing out on alerts because our monitoring platform has gone offline.
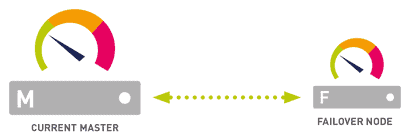
Thankfully the team at Paessler is one step ahead, Automatic Failover Handling is already included as part of the package. Default with every PRTG license, it allows for installation on 2 separate servers, which provides a redundant backup service on standby. In the event your primary master becomes unresponsive, it kicks in and assumes all of the interim responsibilities.
Clustering additional failover nodes is possible, up to a maximum of 4 total, however this does require an extra license per node.
Network Auto-Discovery
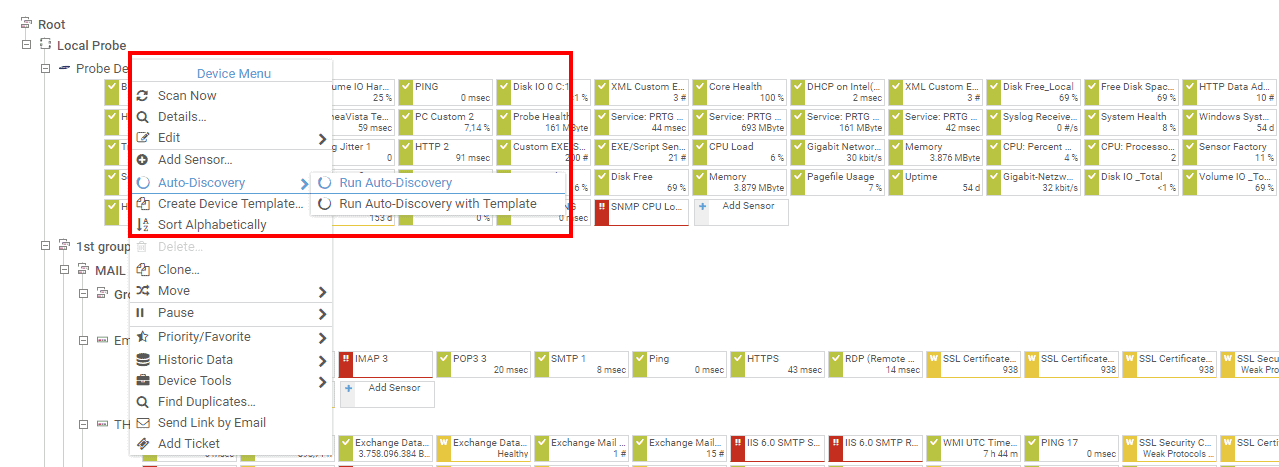
Using Network Auto-Discovery, PRTG can scan a specified IP range and automatically import network connected devices. Using Auto-Discovery with templates, each device can even be assigned a set of predefined sensors that are applicable. This all but eliminates the tedious work of manual data input and configurations.
While this feature is of course great for a quick initial setup, it also simplifies the inventory process too. For medium to large organizations, taking stock of all active devices can be combined with the reporting tools, providing an accurate representation of the entire infrastructure at any time.
Alerts
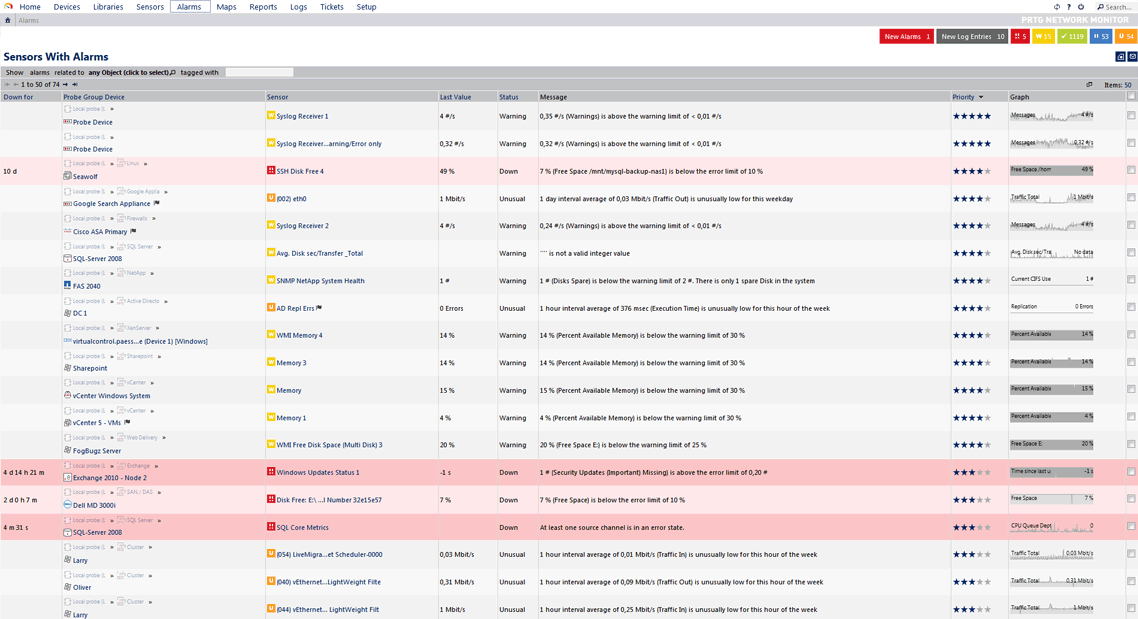
One of the most critical features of network monitoring is the alerts system. Receiving automated notifications of unusual behavior allows you to proactively address concerning situations before they become problematic.
Each individual sensor on PRTG is capable of throwing a custom alert, often based on specified thresholds. For example, disk sensors can alert of low space or high I/O, bandwidth sensors can warn of increased utilization or connectivity problems and process monitoring can even let you know when an application has crashed.
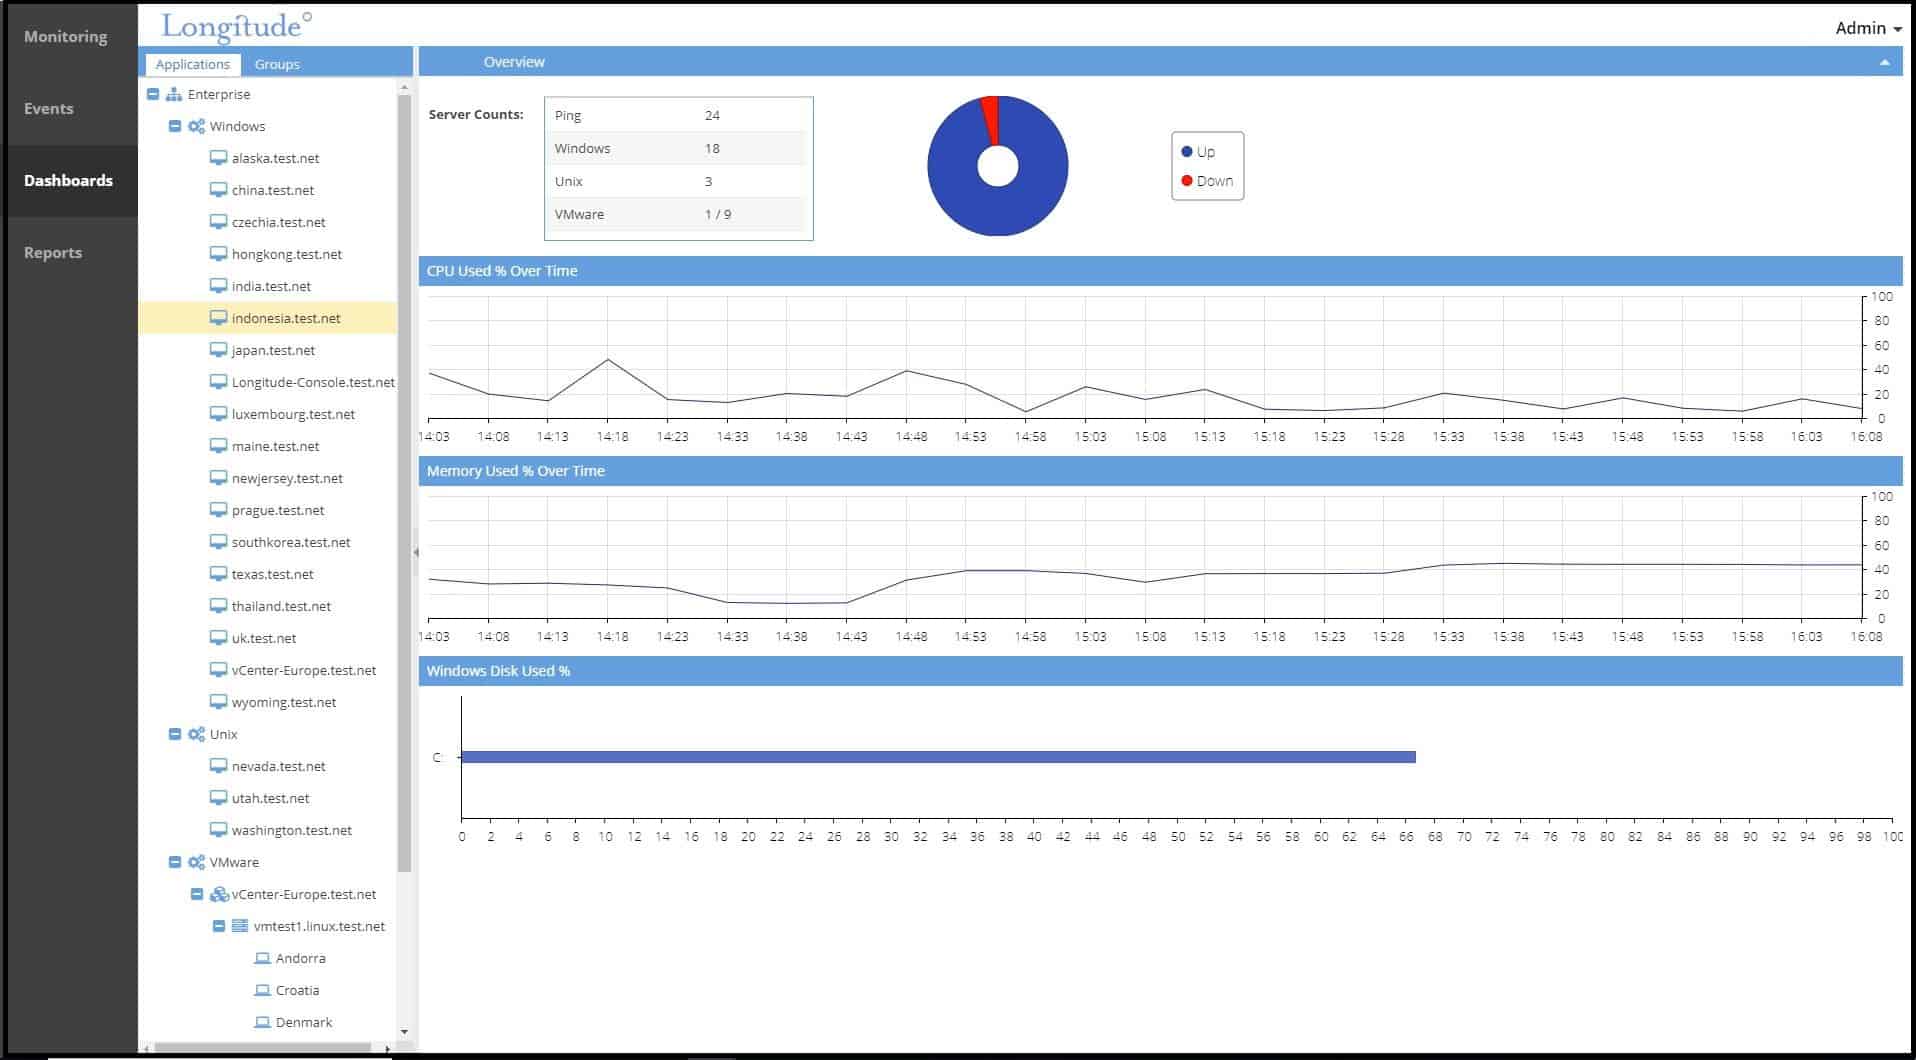
How these alerts are delivered is another point of consideration. Aside from the obvious red status shown on the web interface (pictured above), PRTG has support for sending out Email, SMS and Push notifications as well. With a standalone Windows client, plus apps for both Android and iPhone, these can be sent across a variety of different channels.
If this isn’t enough to satisfy your demands, the powerful API makes it possible to even write your own custom notification scripts. The entire platform is completely extensible and the Alerts system can be adapted to serve almost any requirements.
Maps
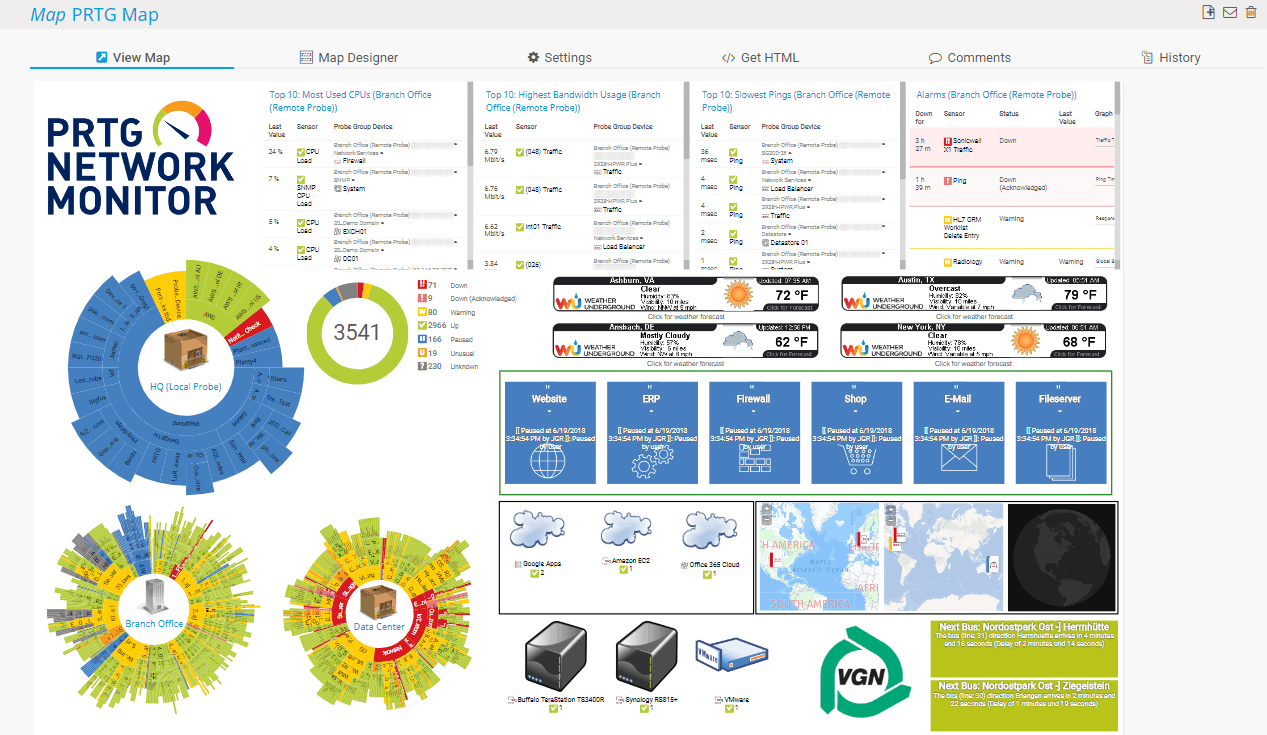
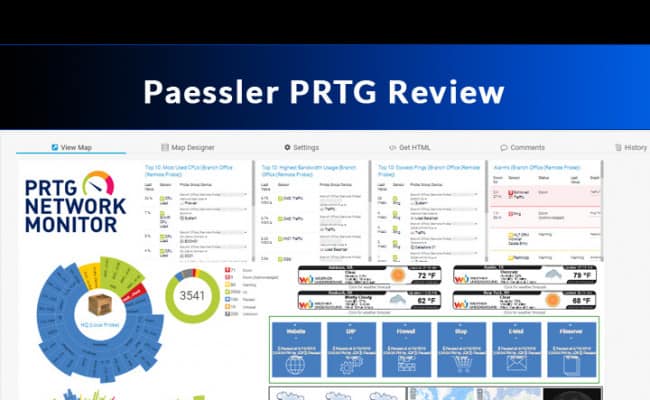
The Maps feature is similar to a dashboard, allowing you to create pages with a live monitoring status in a customizable layout. These aren’t just reserved for back-end users, they can optionally be made public as well, providing your customers with a real time overview of the important systems.
In a nutshell, these are graphical representations comprised of specific elements in your PRTG monitoring system. It can show a list of important sensors, status icons for devices or even an entire schema of your network overview, with lines drawn between each system.
Built with HTML elements, you can individualize the visual components with minimal coding experience. A Map Designer interface is included, which has the tools to help aide in the creation process, allowing you to drag and drop pieces to the page in the location of your choice.
Reporting
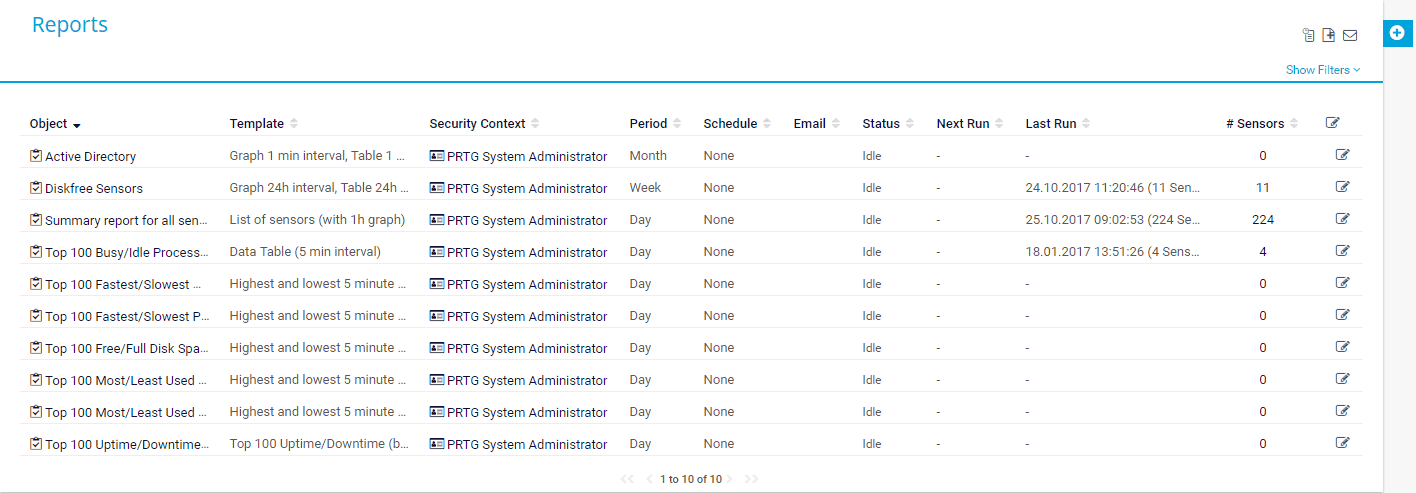
Live views and real-time alerts are at the forefront of networking monitoring, but historical data can be just as important. Being able to collect and analyze information from network components, then present it as a cohesive report can help to identify network trends, performance metrics and determine optimal troubleshooting procedures.
In PRTG, the historic data tab presents this information, although it is only available for sensors (not probes, groups or devices). It can be exported in a number of formats, including PDF, HTML, XML or CSV files. These can be ran on demand or scheduled on a recurring basis (daily, weekly, monthly).
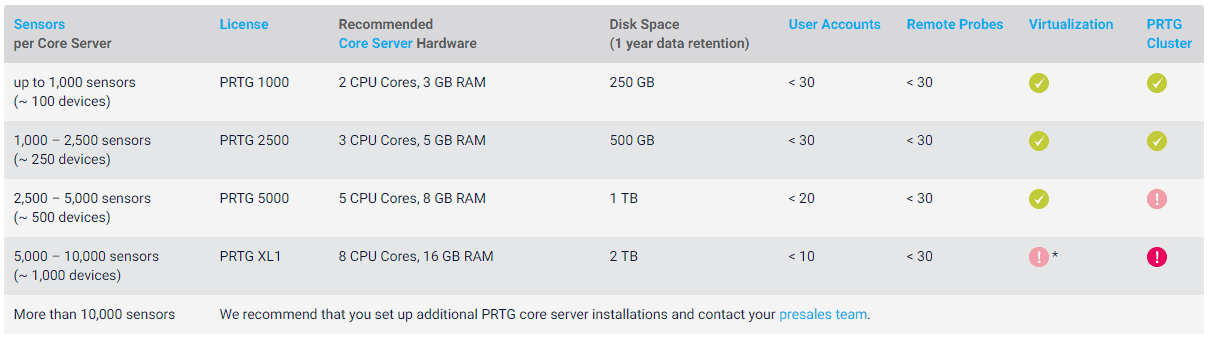
System Requirements
Before installing the PRTG Core Server, it’s important to check that your target machine meets both the general system and hardware requirements. While the recommended hardware increases based on the number of sensors and/or devices in use, the system requirements are the same regardless.
System Requirements
- Use dedicated x64 PC/server hardware (no virtualization)
- Install on Windows 10, Windows Server 2012 R2 or Windows Server 2016
- .NET Framework 4.7.2 must be installed
Hardware Requirements
As for system specs, the absolute minimum hardware needed to run PRTG Core Server is 2 CPU cores, 3 GB RAM and 250 GB disk space (for 1 year of data retention). This is based on 1000 sensors or 100 devices, where Paessler notes the average device consumes 10 sensors.
Price
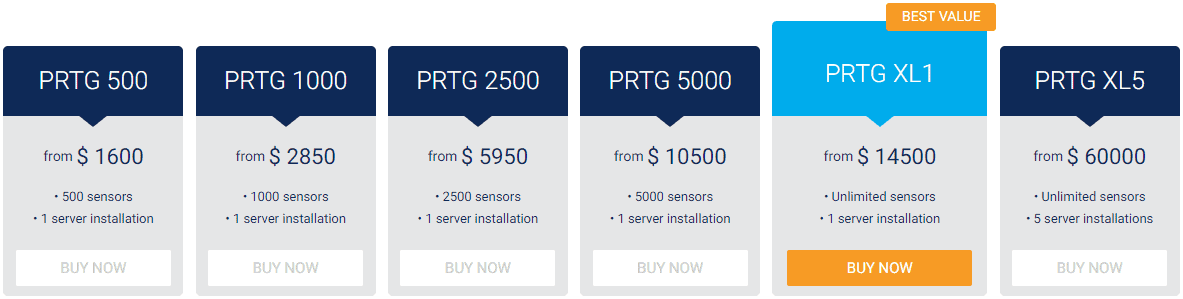
PRTG license pricing is based entirely on the sensor allocation, making it one of the most flexible options for organizations of any size. For small business, this can be quite appealing, as it helps minimize the upfront costs associated with getting started, but also keeps the door open for future growth down the road.
In fact, Paessler even offers a completely Free Version of PRTG, no strings attached. It comes with the full software and a flat 100 sensors that can be assigned without restriction, ideal for learning the ropes and trying it out risk free.
Depending on the usage however, sensors can get used up rather quick. When you inevitably reach the point of needing more, the cost jump up to $1600 for 500 sensors. This is actually quite competitive and beats out many similar products on the market, but may be a tough pill to swallow for those that become accustomed to the free model.
From that point, license tiers roughly double the sensor count per increment, rising gradually until eventually capping out at PRTG XL1 (priced at $14500) which is the entirely unlimited plan, at least for a single installation.
Official Website
Download
https://www.paessler.com/download/prtg-download