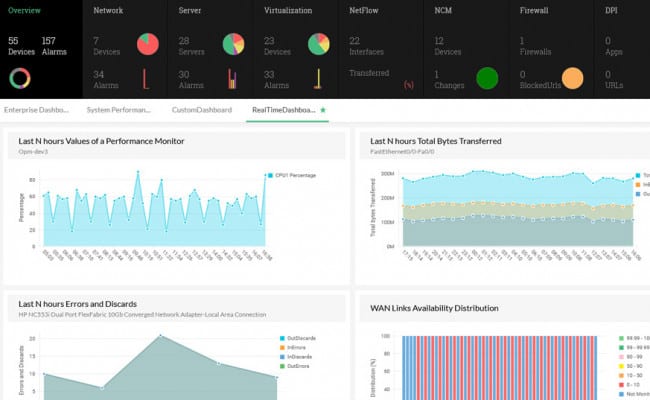
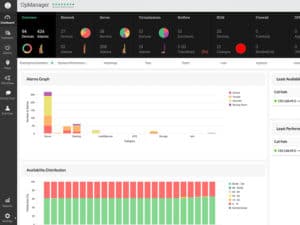
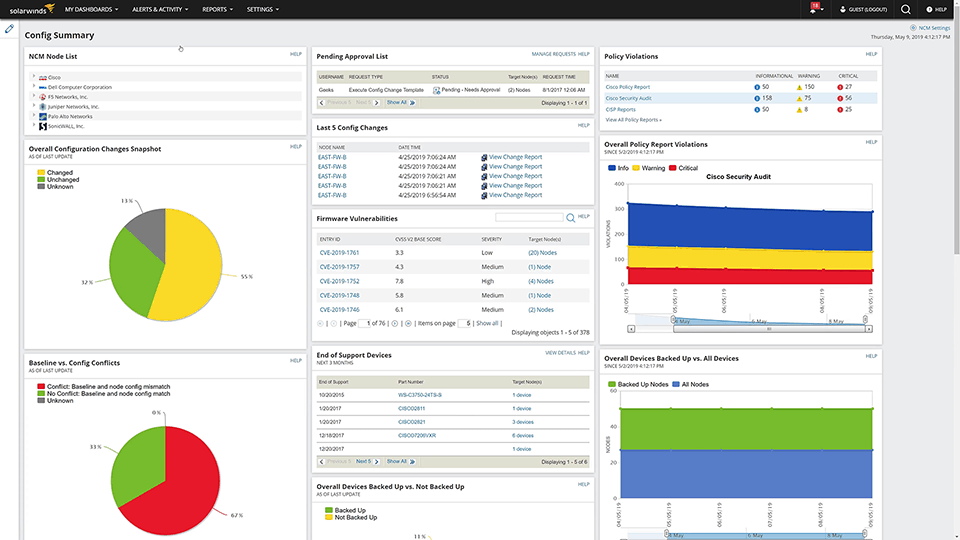
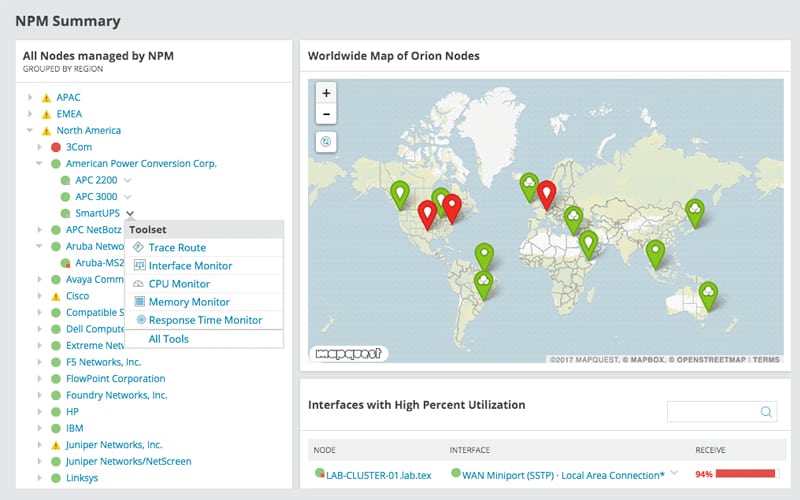
ManageEngine’s OpManager is a powerful, full scale monitoring platform, offering a complete suite of services and features for network administrators. This toolset combines every aspect of infrastructure management in to one simple interface.
Release Notes for ManageEngine OpManager Can be Found Here: Updates & Overview
Updates and Overview
ManageEngine OpManager 12.4 includes dozens of new features they’ve recently introduced to their already robust monitoring platform. Consolidating interface tools, 3rd party service integrations and more than 45,000 new device and vendor templates. Some of our favorite new additions include…
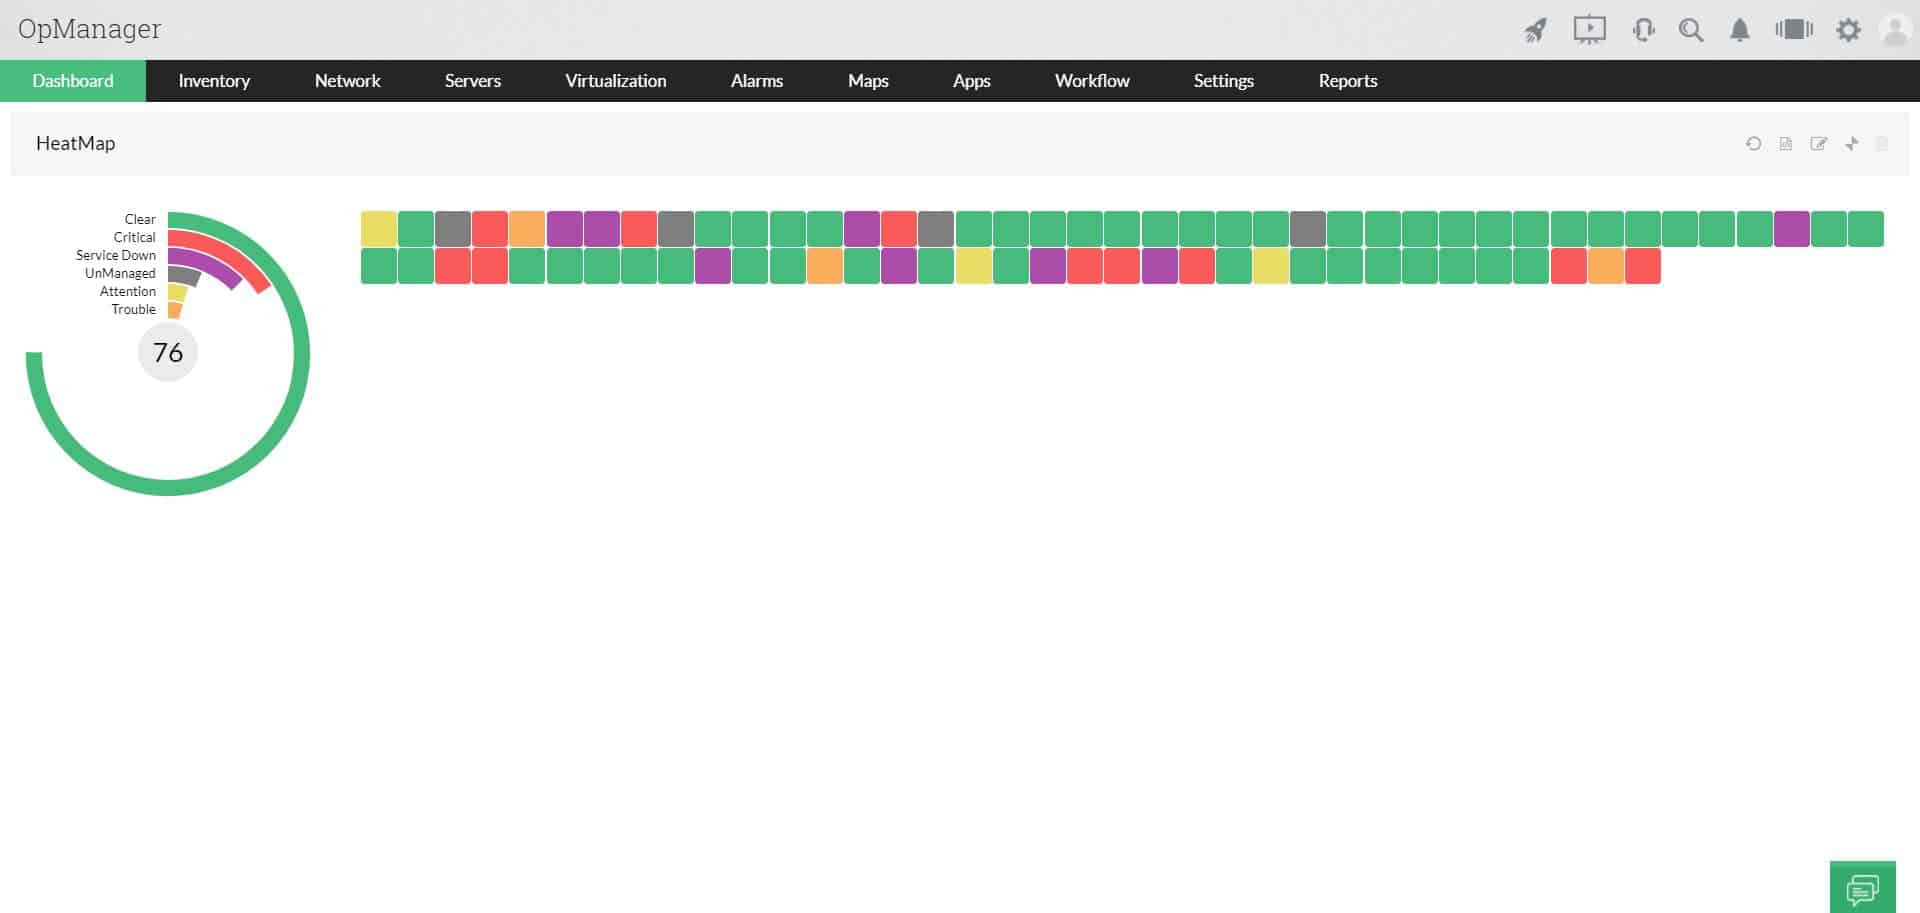
1. Heatmaps
Being able to quickly recognizing problems is imperative, and Heatmaps are one of the easiest ways to visualize these at a glance. Using a simple color coded system, we can view the health of an entire network from a single page. The blocks represent individual devices and whether they are working well, need attention or completely offline.
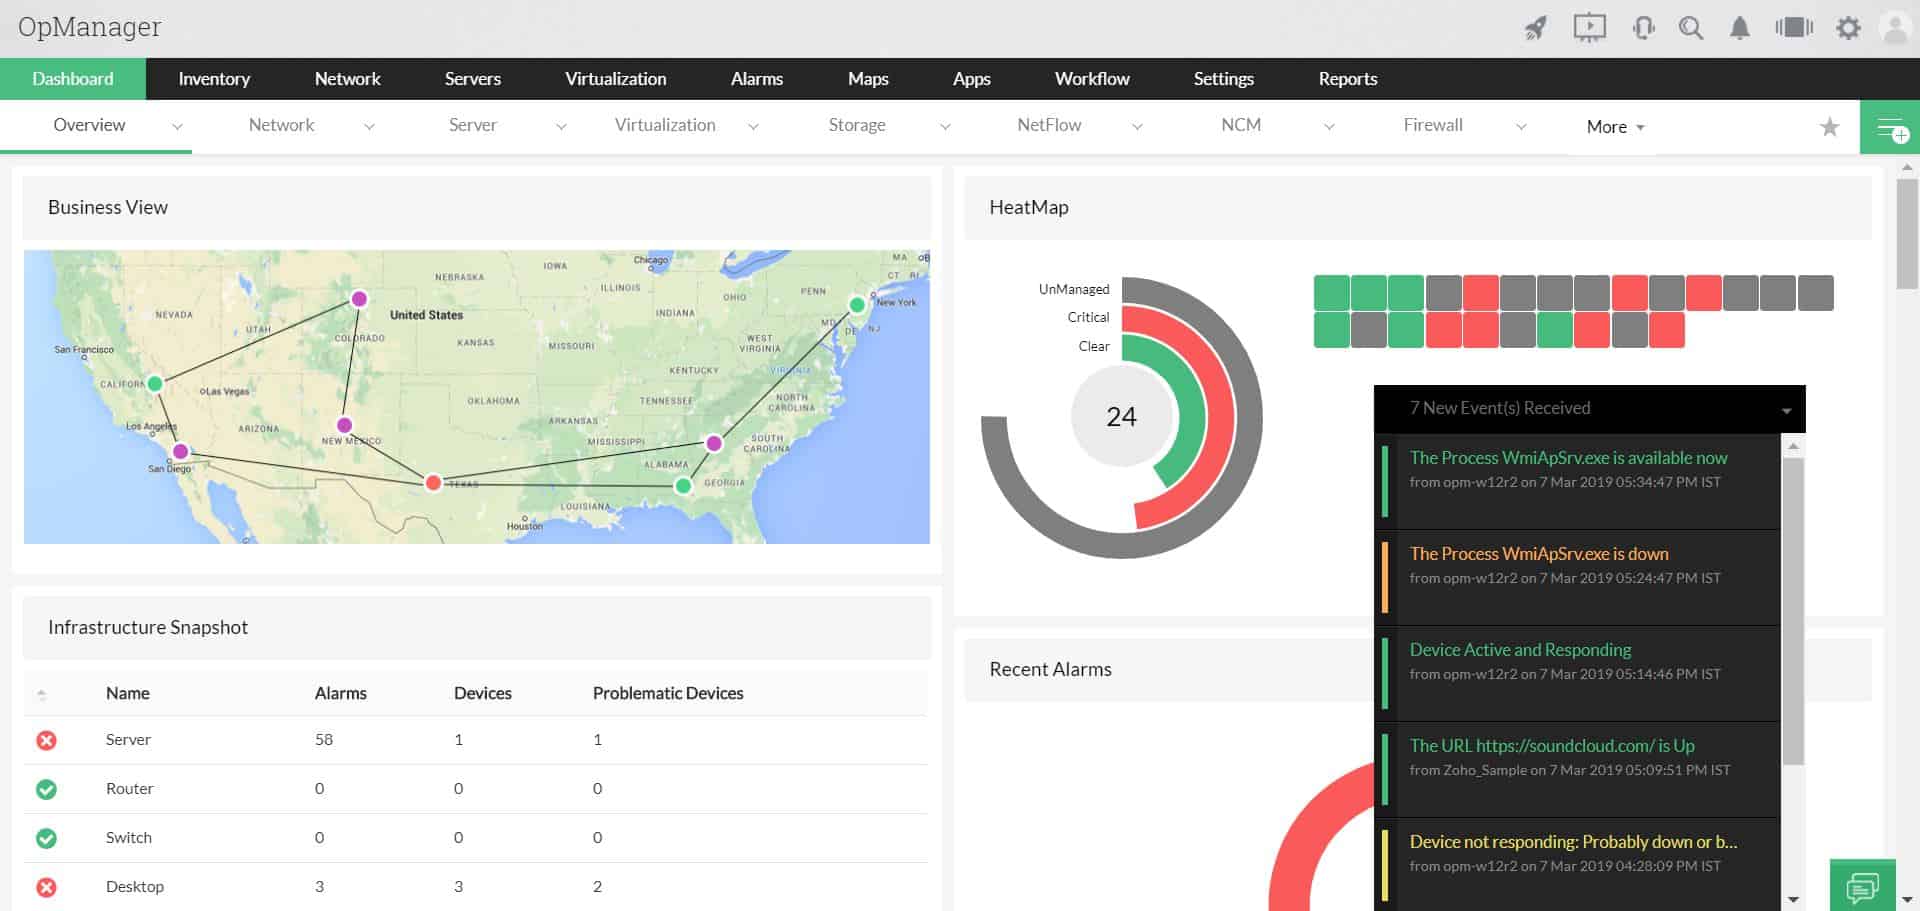
2. Live Popup Notifications
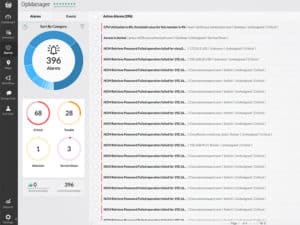
It’s no longer necessary to keep an Alerts page open at all times, Live Popup Notifications follow the user and provide updates as needed. When alarms are raised or other events occur, the message is displayed in the bottom right of the screen for immediate attention.
3. Virtualization Maps
Modern networks are no longer just physical nodes and storage arrays, much of the operations happen within virtual environments. Since these aren’t necessarily comprised of real world components, it can be difficult to visualize the relationships between individual hosts, guests and clusters, seeing how they are connected.
Virtualization maps in ManageEngine’s OpManager however do exactly that. Building a simple tree like diagram, each piece of the virtual network is represented, providing a more complete overview of our entire back-end.
Price
ManageEngine OpManager is licensed as 3 separate editions, each with a free 30 day trial available. The perpetual billing model is based on the version, number of monitored devices and addon-on features (optional).
- OpManager Standard
- Prices starting at $295
- Scalable up to 1000 Devices
- Basic Features
- OpManager Professional
- Prices starting at $345
- Scalable up to 1000 Devices
- Complete Features
- OpManager Enterprise
- Prices starting at $11,545
- Scalable up to 10,000 Devices
- Complete Features
OpManager Free Edition is also available for small business or personal use. It’s limited to a maximum of 3 devices, a single user account and includes basic monitoring functionality.
If these solutions don’t meet your needs, customized packages can be tailored to the individual requirements of each organization. Use the Request a Quote form on their website to contact the sales team for more information.
Features

Network Management
Network Management is at the core of OpManager’s software, essential tools and technologies to monitor and maintain network infrastructure.
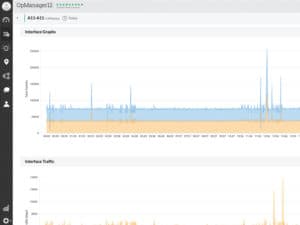
Using more than 2000 performance metrics, the dashboard offers an intuitive look under the hood. Instant alerts and intelligent reporting offer critical insights to proactively keep systems online and operational. Best of all, the health monitor helps identify and address issues with WAN, routers, switches and VoIP.
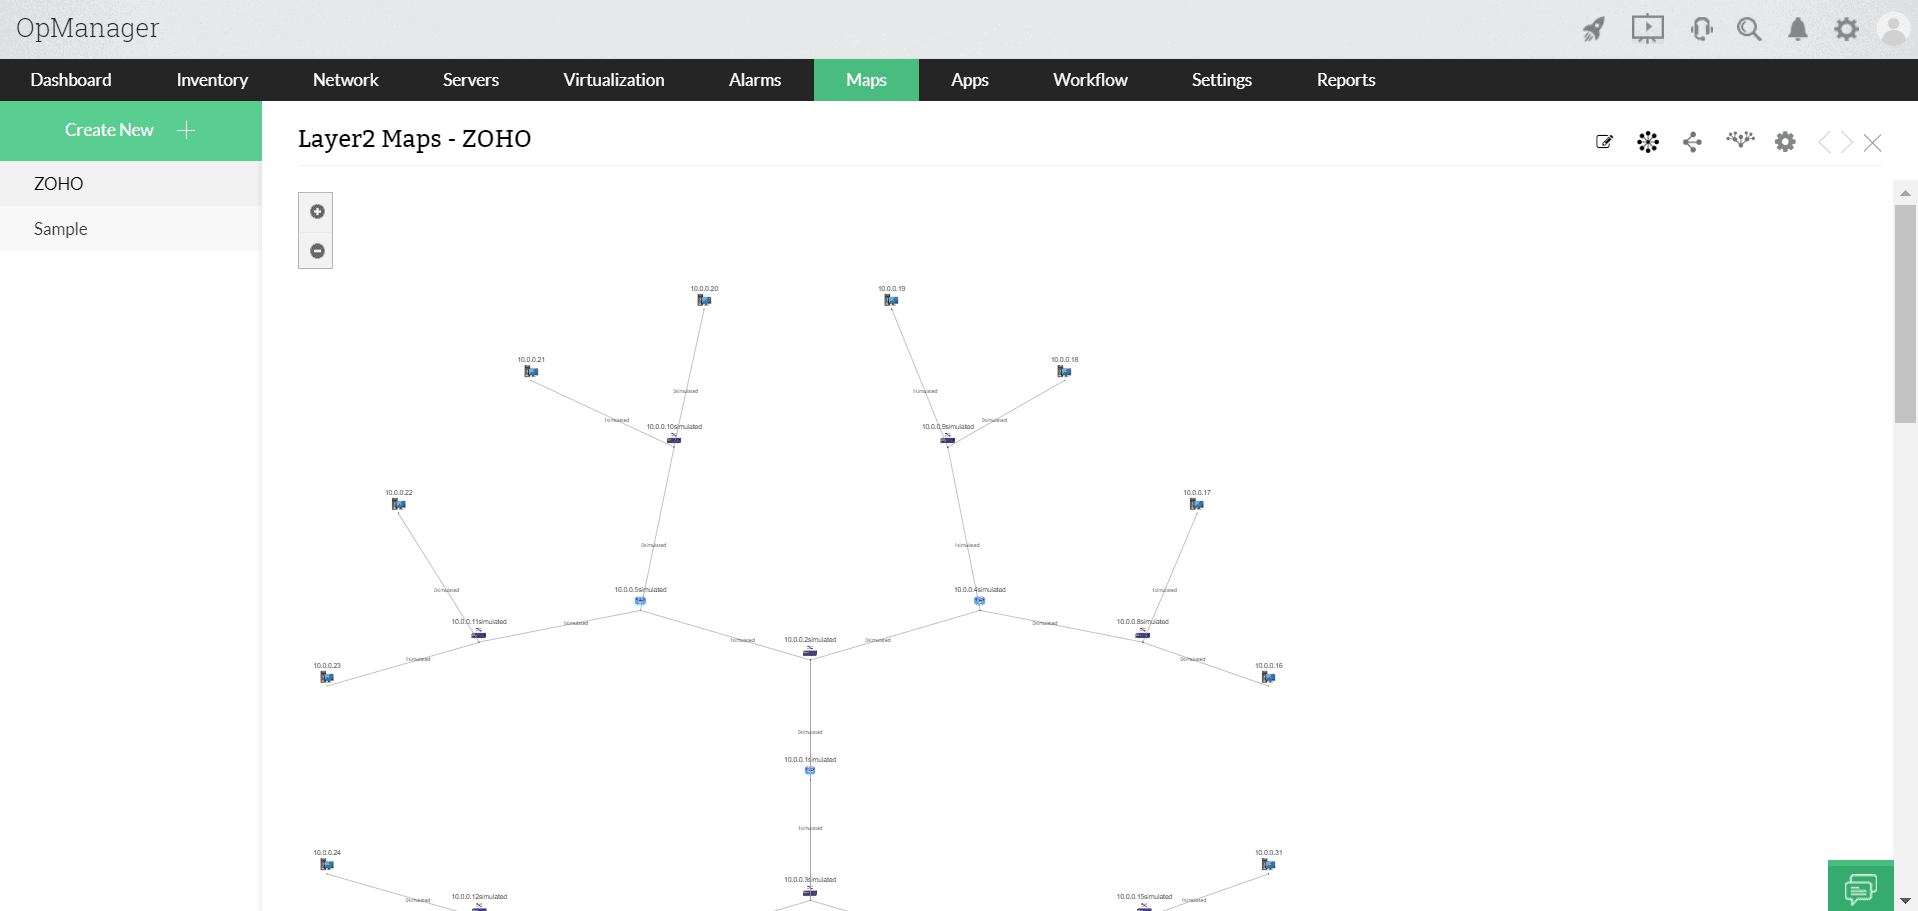
The Network Mapping makes it all possible, able to automate the discovery of new devices and interfaces. Once imported into the hierarchical structure, we can visualize and pinpoint network outages or performance degradation at a moments notice.

Server Management
OpManager features a sophisticated set of server management capabilities, aimed at real-time monitoring for business critical infrastructure.
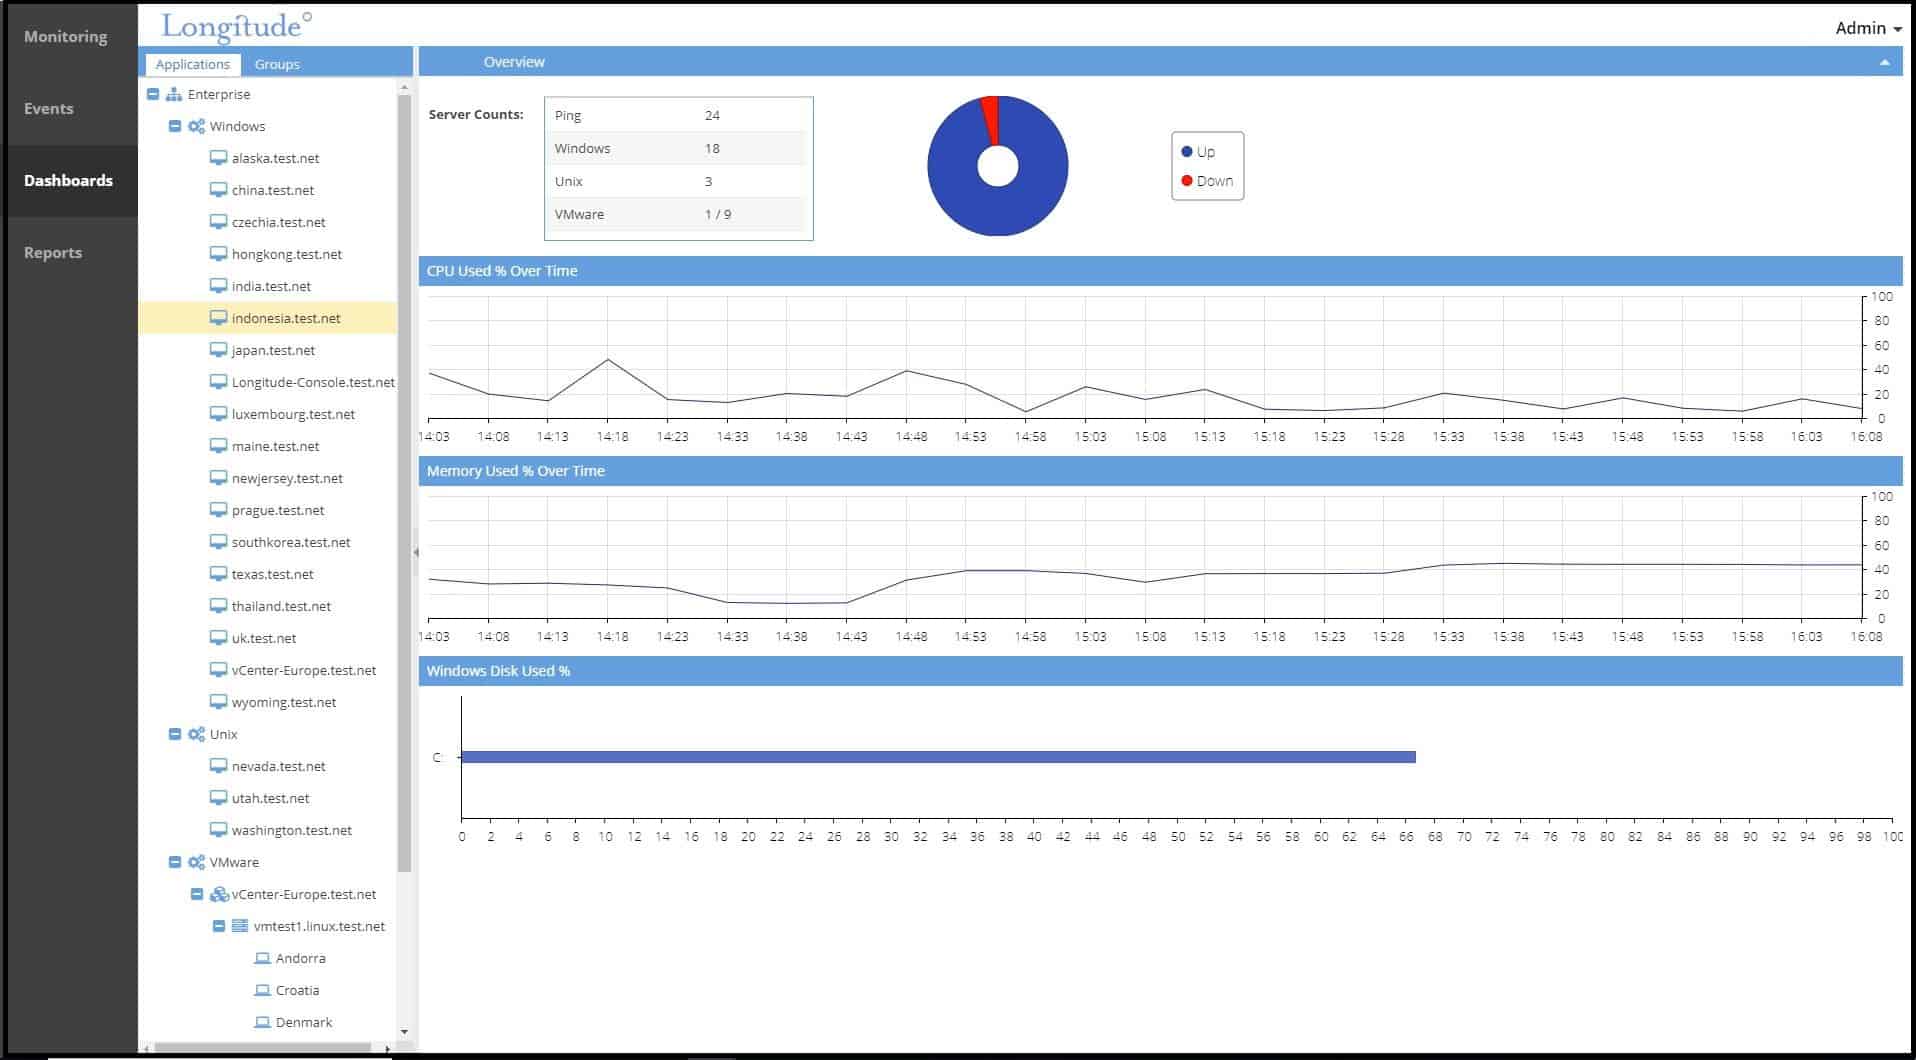
Out of the box, it’s compatible with both physical and virtual servers across a range of supported vendors. This includes Windows, Linux, Unix and Solaris. Virtualization platforms are prominently featured as well. VMWare has agentless monitoring and over 70 performance sensors, Hyper-V has 40 in-depth host/guest metrics, and Citrix XenServer can provide performance visibility for hosts, VMs and storage repositories.
System health and process monitoring are implemented across standard protocols such as SNMP, WMI and CLI. These provide insight in to the resource utilization, active services and performance data of individual network devices.

Fault and Performance Management
Detecting problems before they disrupt operations is a key aspect of network administration. OpManager classifies this specific subset of tools as Fault and Performance Management, comprised of various alerting, reporting and monitoring systems.
The SNMP Trap Engine is capable of processing 300 traps per second, identifying notable performance deviations between polls. In many cases, their Workflow Automation can handle simple L1 faults without user intervention. Low level troubleshooting and maintenance tasks can be completed through the interface without ever leaving the desk!
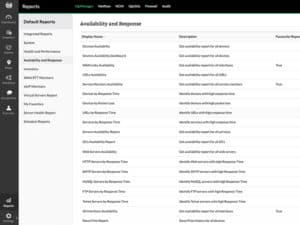
Instant notifications keep you informed and up to date on events, even when on the go. Event alarms can be sent via E-mail or SMS text messages, based on the defined thresholds. To review historical performance data after the fact, reporting offers a complete analysis of network availability and usage trends across 100+ built-in profiles.

Datacenter Management
Even the largest of enterprise rarely operate a full scale datacenter on premise, but for those that do, OpManager has you covered. With tools like 3D Datacenter Floor, you can create a digital replica of the floor plan, complete with a live rack view showing real-time, color coded status updates.
Embeded in the NOC screens, it provides 24/7 monitoring of all IT systems, including physical and virtual servers, routers and switches, load balancers, firewalls and more.

DIY Deployment
Software rollouts can be expensive for your business, often requiring specialized technicians and on-site training. ManageEngine recognized this as a problem to solve, automating much of the work behind the scenes.
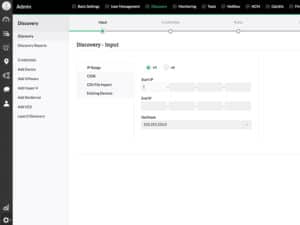
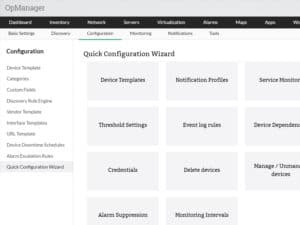
Utilizing features such as the Automatic Network Discovery, Discovery Rules Engine and Monitoring Templates, most of the hard work is done for you.
The discovery engine can import up to 15,000 interfaces in under a minute, assigning device profiles and monitors upon initial discovery. With Monitoring Templates, you simply specify details such as parameters and intervals and OpManager takes care of the rest.
System Requirements
The basic system requirements for the latest version of ManageEngine OpManager can be found on their website.
Software Requirements
- For evaluation purposes, ManageEngine OpManager has been tested and confirmed to work on the following operating systems…
- Windows 7, 8 and 10
- Windows Server 2008, 2012/R2, 2016 and 2019
- Ubuntu
- Suse
- Red Hat
- Fedora
- Mandriva (Mandrake Linux)
- For production environments, ManageEngine OpManager recommends…
- Windows Server 2008, 2012/R2, 2016 or 2019
- Red Hat / 64 bit Linux flavors
- Modern web browser support includes Chrome (preferred), Firefox, Edge and IE 11.
- Supported databases include…
- PostgreSQL (bundled with package)
- Microsoft SQL 2008, 2012, 2014 and 2016
Hardware Requirements
Requirements are based on the Standard and Professional licenses, without add-ons included. The recommended CPU specs are defined using PassMark scores as a rating.
It is strongly advised to use a physical dedicated server for running the OpManager Software.
| 250 Devices | 500 Devices | 1000+ Devices | |
|---|---|---|---|
| Processor(s) | Intel Xeon 2.0 Ghz 4 cores/ 4 threads | Intel Xeon 2.5 Ghz 4 cores/ 8 threads | Intel Xeon 2.5 Ghz 4 cores/ 8 threads (or better) |
| Memory | 4 GB RAM | 8 GB RAM | 16 GB RAM |
| Disk | 20 GB Space (Minimum) | 20 GB Space (Minimum) | 20 GB Space (Minimum) |
For the Enterprise edition or any version running add-ons, ManageEngine suggests using an Intel Xeon 3.5 GHz 4 cores/ 8 threads or higher, with a minimum PassMark score of 7000 or higher. This applies to both the Central and Probe servers.
Screenshots
Download
OpManager can be downloaded from the official ManageEngine website at the link below.
